README
cucumber-electron
Runs Cucumber.js in an Electron renderer process. Scenarios have direct access to both a browser DOM and node.js libraries, so they are fast and easy to debug interactively.
![]()
Install
Both Electron and Cucumber.js need to be installed, they are peer dependencies. This gives you the option to choose the version you want to use:
npm install --save-dev electron @cucumber/cucumber @cucumber/electron
Usage
Cucumber-electron is a wrapper around Cucumber.js, supporting the same features and command-line options. You should be able to use it on your project without any changes.
Run cucumber-electron like it was Cucumber.js, for example:
npx cucumber-electron ./features/your.feature:123
API
Cucumber Electron provides an API that you can use in your step definitions or hooks.
App Elements
An app element is a DOM element where you can mount the application or component under test.
const { AppElements } = require('@cucumber/cucumber-electron')

Before(function () {
  this.appElements = new AppElements()
})

Given('{word} has an app element', function (name) {
  const appElement = this.appElements.create(document, name)

  // Mount a React Component
  ReactDOM.render(<MyComponent />, appElement)

  // Mount a Vue component
  new Vue({ el: appElement })

  // Vanilla DOM
  appElement.innerHTML = '<h1>Hello World</h1>'
})

After(function () {
  if (!process.env.CUCUMBER_ELECTRON_KEEP_APP_ELEMENTS) {
    // Destroy all app elements after each scenario
    this.appElements.destroyAll()
  }
})
In interactive debugging mode this will look something like this:
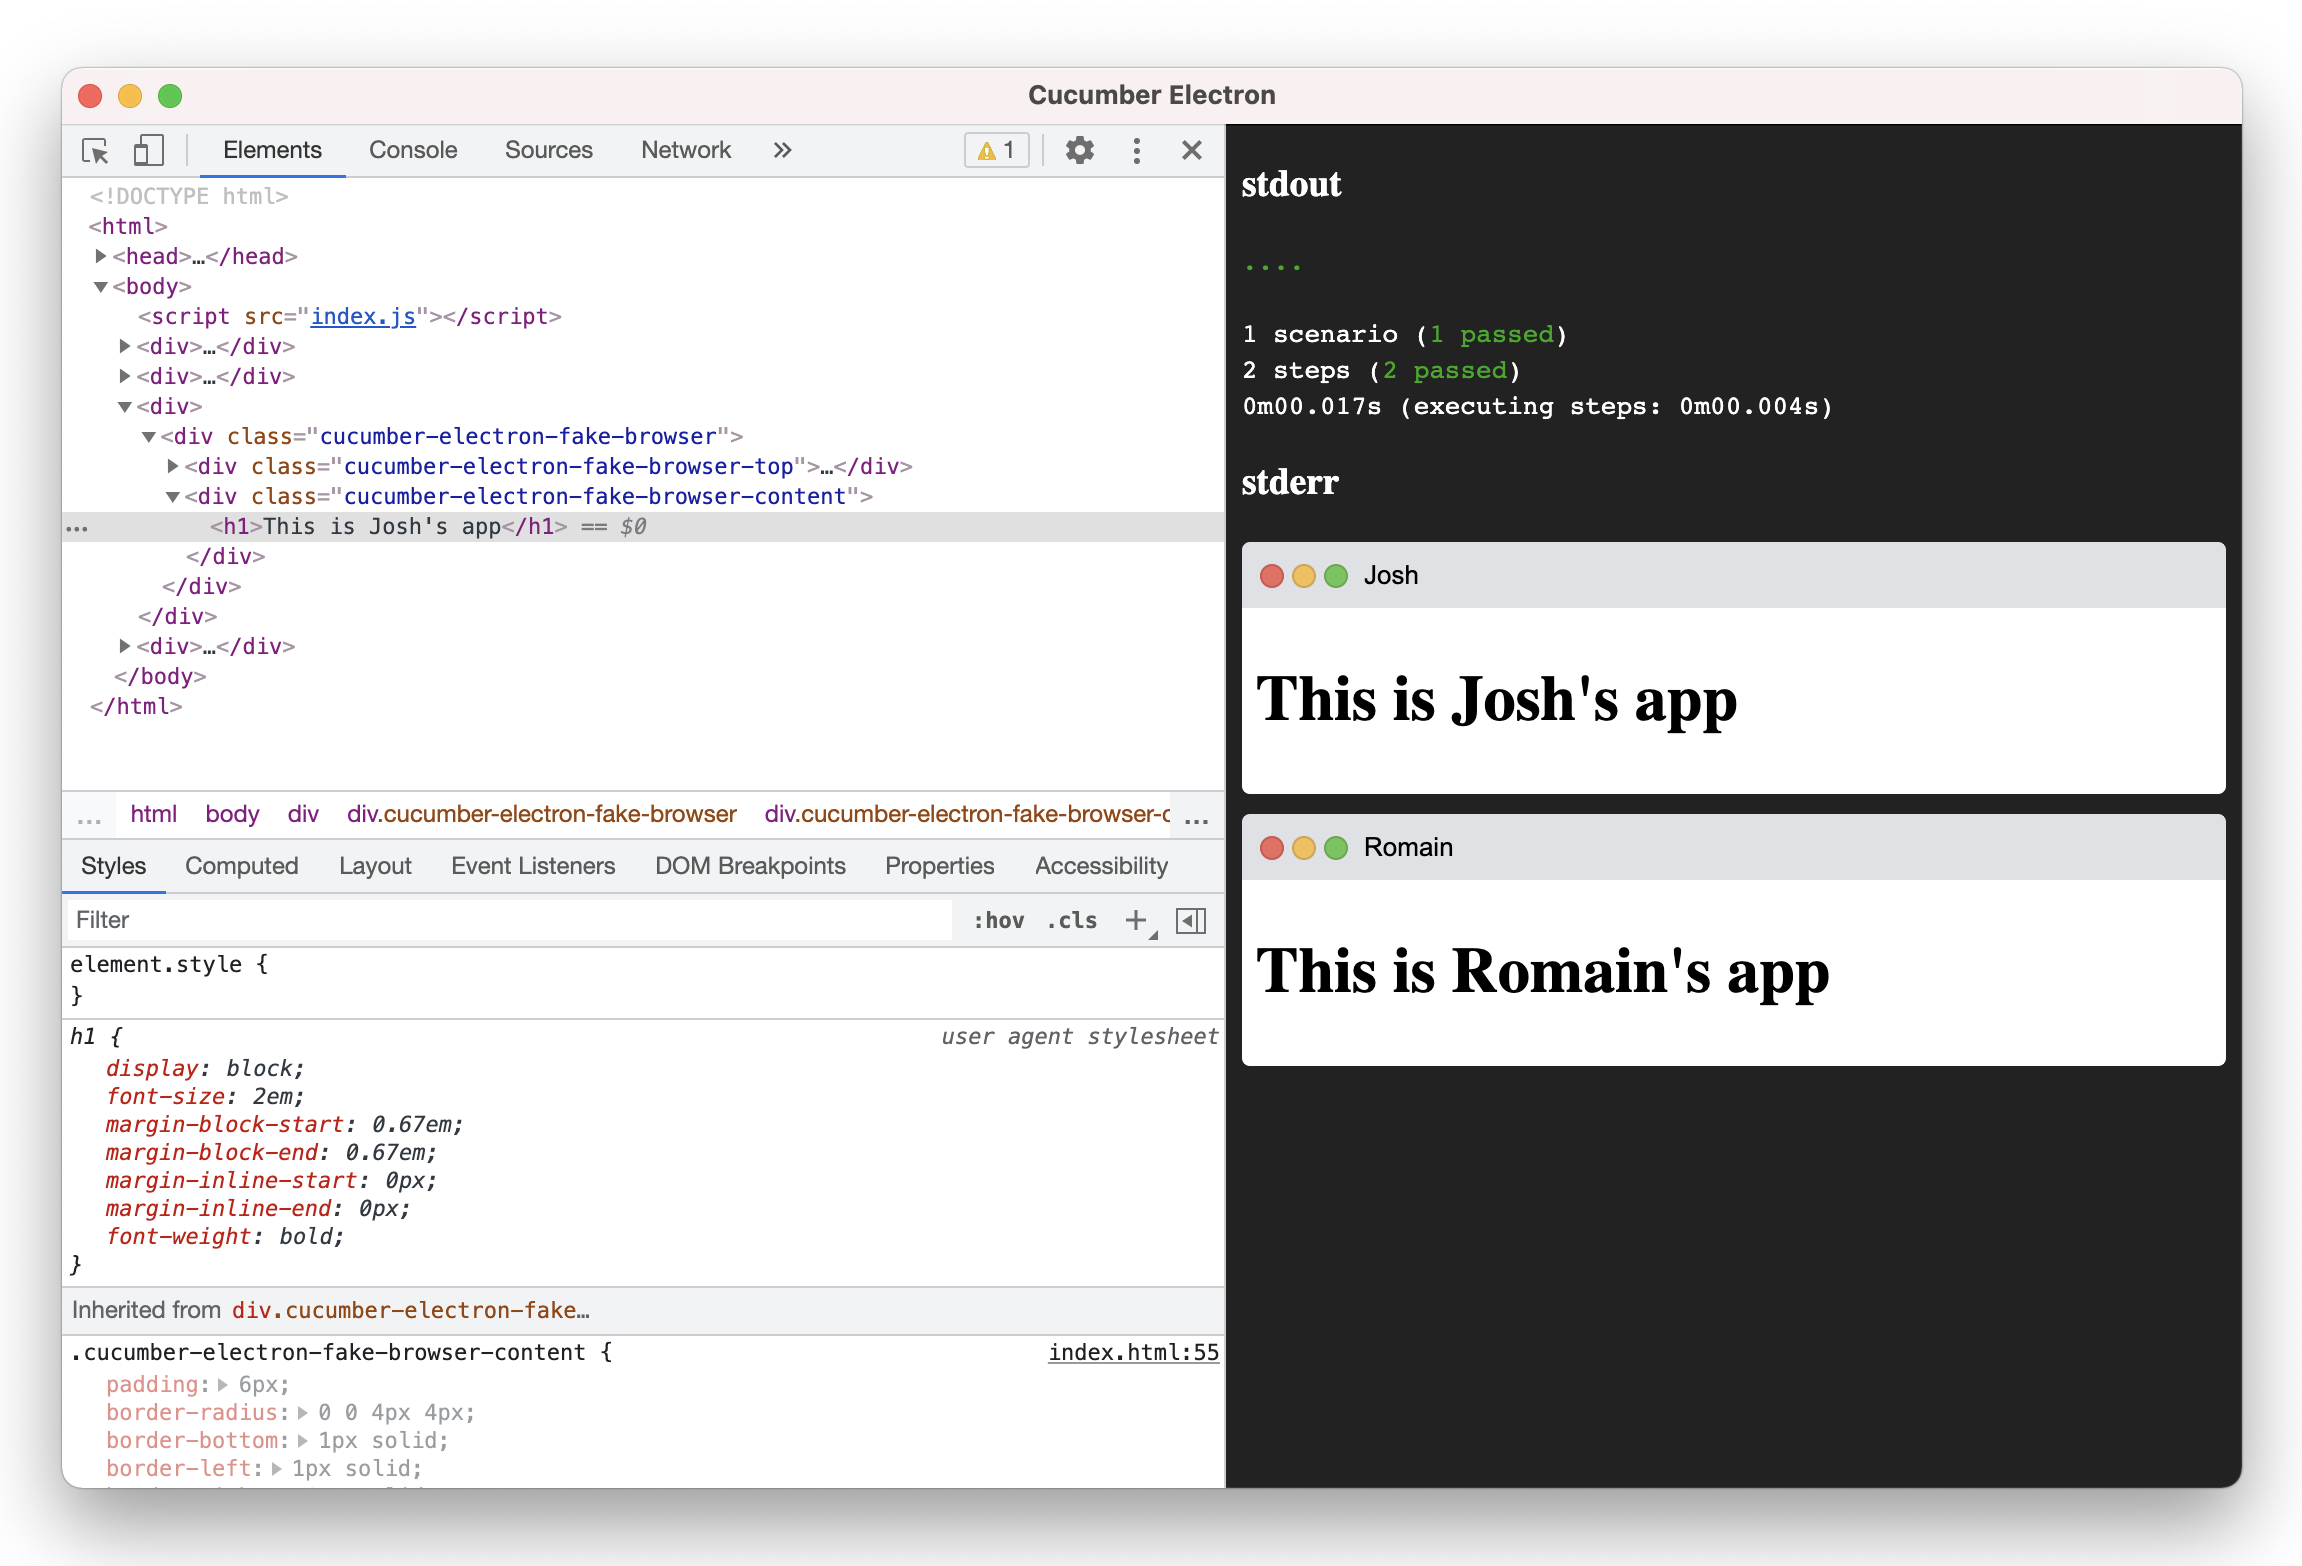
See the app-elements example for more details.
You can run it like this:
CUCUMBER_ELECTRON_KEEP_APP_ELEMENTS=1 ./bin/cucumber-electron.js examples/app-elements --interactive
Interactive Debugging
The --interactive (or -i) command line switch shows a browser window with chrome dev tools and keeps
the window open after all features have finished running.
The interactive debugger will halt execution on any debugger statements, or breakpoints you have set in chrome dev tools.
In interactive mode you can re-run all your scenarios by pressing CMD-R (MacOS) or CTRL-R (Windows/Linux)
while the browser window has focus.
Custom Stylesheet
You can add a custom stylesheet to the DOM with the --stylesheet [PATH] option.