README
![]()
NestJS OpenTelemetry


This library provides deeply integrated protocol-agnostic Nestjs OpenTelemetry instrumentations, metrics and SDK.
Description
Nestjs is a protocol-agnostic framework. That's why this library can able to work with different protocols like RabbitMQ, GRPC and HTTP. Also you can observe and trace Nestjs specific layers like Pipe, Guard, Controller and Provider.
It also includes auto trace and metric instrumentations for some popular Nestjs libraries.
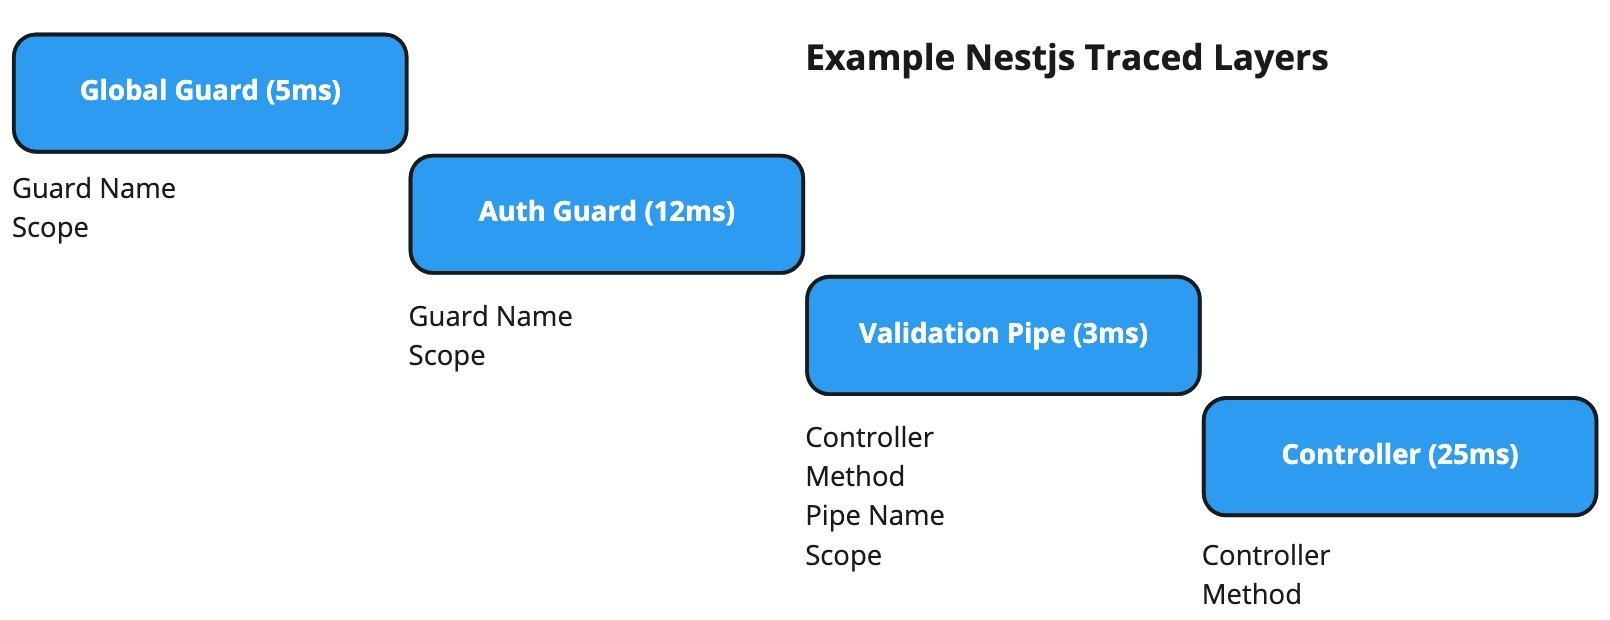
Distributed Tracing
Metrics
Installation
npm install @metinseylan/nestjs-opentelemetry --save
Configuration
This is a basic configuration without any trace and metric exporter, but includes default metrics and injectors
import { OpenTelemetryModule } from '@metinseylan/nestjs-opentelemetry';

@Module({
  imports: [OpenTelemetryModule.forRoot()]
})
export class AppModule {}
Default Parameters
| key | value | description |
|---|---|---|
| traceAutoInjectors | ControllerInjector, GuardInjector, EventEmitterInjector, ScheduleInjector, PipeInjector, LoggerInjector | default auto trace instrumentations |
| metricAutoObservers | ResourceMetric, ProcessStartTimeMetric, ProcessOpenFdsMetric, ProcessMaxFdsMetric, ActiveHandlesMetric, ActiveHandlesTotalMetric, HttpRequestDurationSeconds, GrpcRequestDurationSeconds, RabbitMqRequestDurationSeconds | default auto metric collectors |
| autoDetectResources | true | inherited from NodeSDKConfiguration |
| contextManager | AsyncLocalStorageContextManager | default trace context manager inherited from NodeSDKConfiguration |
| instrumentations | HttpInstrumentation | default instrumentations inherited from NodeSDKConfiguration |
| spanProcessor | NoopSpanProcessor | default spanProcessor inherited from NodeSDKConfiguration |
| textMapPropagator | JaegerPropagator, B3Propagator | default textMapPropagator inherited from NodeSDKConfiguration |
OpenTelemetryModule.forRoot() takes OpenTelemetryModuleConfig as a parameter, this type is inherited by NodeSDKConfiguration so you can use same OpenTelemetry SDK parameter.
Distributed Tracing
Simple setup with Zipkin exporter, including with default trace instrumentations.
import { OpenTelemetryModule } from '@metinseylan/nestjs-opentelemetry';
import { ZipkinExporter } from '@opentelemetry/exporter-zipkin';
import { SimpleSpanProcessor } from '@opentelemetry/sdk-trace-base';

@Module({
  imports: [
    OpenTelemetryModule.forRoot({
      spanProcessor: new SimpleSpanProcessor(
        new ZipkinExporter({
          url: 'your-zipkin-url',
        })
      ),
    }),
  ],
})
export class AppModule {}
After setup, your application will be instrumented, so that you can see almost every layer of application in ZipkinUI, including Guards, Pipes, Controllers even global layers like this
List of supported official exporters here.
Trace Decorators
This library supports auto instrumentations for Nestjs layers, but sometimes you need to define custom span for specific method blocks like providers methods. In this case @Span decorator will help you.
import { Injectable } from '@nestjs/common';
import { Span } from '@metinseylan/nestjs-opentelemetry';

@Injectable()
export class AppService {
  @Span()
  getHello(): string {
    return 'Hello World!';
  }
}
Also @Span decorator takes name field as a parameter
@Span('hello')
Trace Providers
In an advanced usage case, you need to access the native OpenTelemetry Trace provider to access them from Nestjs application context.
import { Injectable } from '@nestjs/common';
import { Tracer } from '@opentelemetry/sdk-trace-base';

@Injectable()
export class AppService {
  constructor(private readonly tracer: Tracer) {}

  getHello(): string {
    const span = this.tracer.startSpan('important_section_start');
    // do something important
    span.setAttributes({ userId: 1150 });
    span.end();
    return 'Hello World!';
  }
}
TraceService can access directly current span context and start new span.
import { Injectable } from '@nestjs/common';
import { TraceService } from '@metinseylan/nestjs-opentelemetry';

@Injectable()
export class AppService {
  constructor(private readonly traceService: TraceService) {}

  getHello(): string {
    const span = this.traceService.startSpan('hello');
    // do something
    span.end();
    return 'Hello World!';
  }
}
Auto Trace Instrumentations
The most helpful part of this library is that you already get all of the instrumentations by default if you set up a module without any extra configuration. If you need to avoid some of them, you can use the traceAutoInjectors parameter.
import { Module } from '@nestjs/common';
import {
  OpenTelemetryModule,
  ControllerInjector,
  EventEmitterInjector,
  GuardInjector,
  LoggerInjector,
  PipeInjector,
  ScheduleInjector,
} from '@metinseylan/nestjs-opentelemetry';
import { ZipkinExporter } from '@opentelemetry/exporter-zipkin';
import { SimpleSpanProcessor } from '@opentelemetry/sdk-trace-base';

@Module({
  imports: [
    OpenTelemetryModule.forRoot({
      traceAutoInjectors: [
        ControllerInjector,
        GuardInjector,
        EventEmitterInjector,
        ScheduleInjector,
        PipeInjector,
        LoggerInjector,
      ],
      spanProcessor: new SimpleSpanProcessor(
        new ZipkinExporter({
          url: 'your-zipkin-url',
        }),
      ),
    }),
  ]
})
export class AppModule {}
List of Trace Injectors
| Instance | Description |
|---|---|
ControllerInjector |
Auto trace all of module controllers |
GuardInjector |
Auto trace all of module guards including global guards |
PipeInjector |
Auto trace all of module pipes including global pipes |
EventEmitterInjector |
Auto trace for @nestjs/event-emitter library, supports all features |
ScheduleInjector |
Auto trace for @nestjs/schedule library, supports all features |
LoggerInjector |
ConsoleLogger and Logger class tracer, logs with traceId |
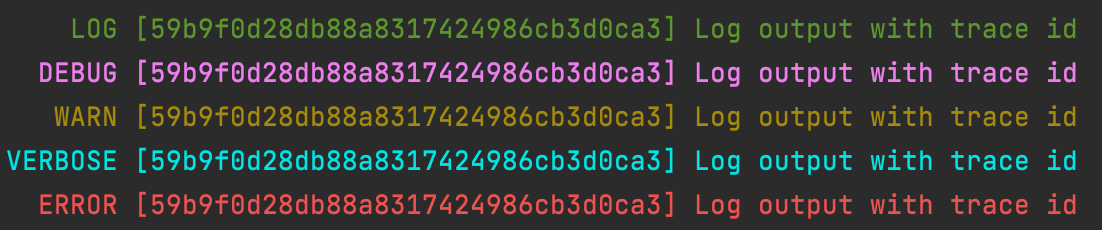
Distributed Logging with Trace ID
When you set up your environment with the LoggerInjector class or default configuration, you can see trace id with every log.
Metrics
Simple setup with Prometheus exporter, you need install @opentelemetry/exporter-prometheus
import { OpenTelemetryModule } from '@metinseylan/nestjs-opentelemetry';
import { PrometheusExporter } from '@opentelemetry/exporter-prometheus';

@Module({
  imports: [OpenTelemetryModule.forRoot({
    metricExporter: new PrometheusExporter({
      endpoint: 'metrics',
      port: 9464,
    })
  })]
})
export class AppModule {}
Now you can access Prometheus exporter with auto collected metrics http://localhost:9464/metrics. Also, you can find different exporters here
Metric Decorators
If you need to observe simple block of function, you can use some basic decorators like @Counter and @Observer
Counter
import { Injectable } from '@nestjs/common';
import { Counter } from '@metinseylan/nestjs-opentelemetry';

@Injectable()
export class AppService {
  @Counter()
  getHello(): string {
    return 'Hello World!';
  }
}
@Counter decorator is uses OpenTelemetry Counter metric, If you check prometheus exporter you will see metric appservice_gethello_total
@Counter('call_me_mr_fahrenheit', {
  description: 'important function call counting here.'
})
And of course, you can configure your decorator metric, the first parameter is "name" and the second one is MetricOptions
Observer
import {Injectable} from '@nestjs/common';
import {Observer} from "./Observer";

@Injectable()
export class AppService {
  @Observer('nice_one_observer', {
    description: 'some description here.',
    boundaries: [10, 20, 30],
  })
  getHello(): string {
    return 'Hello World!';
  }
}
@Observer decorator uses OpenTelemetry ValueRecorder metric. If you check Prometheus exporter, you will see metric and configuration parameters same as @Counter.
Metric Providers
In advanced usage cases, you need to access the native OpenTelemetry Metric provider to access them from the Nestjs application context.
import { Injectable } from '@nestjs/common';
import { Meter } from '@opentelemetry/sdk-metrics-base';
import { Counter } from '@opentelemetry/api-metrics';

@Injectable()
export class AppService {
  private readonly counter: Counter;

  constructor(private readonly meter: Meter) {
    this.counter = this.meter.createCounter('handsome_counter');
  }

  getHello(): string {
    this.counter.add(1);
    return 'Hello World!';
  }
}
Auto Metric Observers
This library has extendable resource and protocol-specific Auto Observers. All of them come with default module configuration, which you can extend and configure.
import { Module } from '@nestjs/common';
import { PrometheusExporter } from '@opentelemetry/exporter-prometheus';
import {
  ActiveHandlesMetric,
  HttpRequestDurationSeconds,
  OpenTelemetryModule,
} from '@metinseylan/nestjs-opentelemetry';

@Module({
  imports: [
    OpenTelemetryModule.forRoot({
      metricAutoObservers: [
        HttpRequestDurationSeconds.build({
          boundaries: [20, 30, 100],
        }),
        ActiveHandlesMetric,
      ],
      metricExporter: new PrometheusExporter({
        endpoint: 'metrics',
        port: 9464,
      }),
      metricInterval: 1000,
    }),
  ],
})
export class AppModule {}
.build function takes MetricOptions as a parameter.
List Of Auto Observers
| Metric Observer Provider | Description | Configurable |
|---|---|---|
HttpRequestDurationSeconds |
Observe http request duration | yes |
GrpcRequestDurationSeconds |
Observe grpc request duration | yes |
RabbitMqRequestDurationSeconds |
Observe rabbitmq request duration | yes |
ResourceMetric |
Metrics of cpu, memory usage | no |
ProcessStartTimeMetric |
Start time of the process since unix epoch in seconds. | no |
ProcessOpenFdsMetric |
Number of open file descriptors. | no |
ProcessMaxFdsMetric |
Maximum number of open file descriptors. | no |
ActiveHandlesMetric |
Number of active libuv handles grouped by handle type. Every handle type is C++ class name. | no |
ActiveHandlesTotalMetric |
Total number of active handles. | no |
Example Output for HttpRequestDurationSeconds
| Key | Value |
|---|---|
| exception | Empty string or exception instance name |
| method | GET, POST, PUT, PATCH, DELETE |
| outcome | INFORMATIONAL, SUCCESS, REDIRECTION, CLIENT_ERROR, SERVER_ERROR |
| status | number of HttpStatus |
| uri | url path |
Lets Combine All of them
import { Module } from '@nestjs/common';
import { PrometheusExporter } from '@opentelemetry/exporter-prometheus';
import { OpenTelemetryModule } from '@metinseylan/nestjs-opentelemetry';
import { ZipkinExporter } from '@opentelemetry/exporter-zipkin';
import { SimpleSpanProcessor } from '@opentelemetry/sdk-trace-base';

@Module({
  imports: [
    OpenTelemetryModule.forRoot({
      metricExporter: new PrometheusExporter({
        endpoint: 'metrics',
        port: 9464,
      }),
      metricInterval: 1000,
      spanProcessor: new SimpleSpanProcessor(
        new ZipkinExporter({
          url: 'your-zipkin-url',
        })
      ),
    }),
  ],
})
export class AppModule {}