README
hill-chart
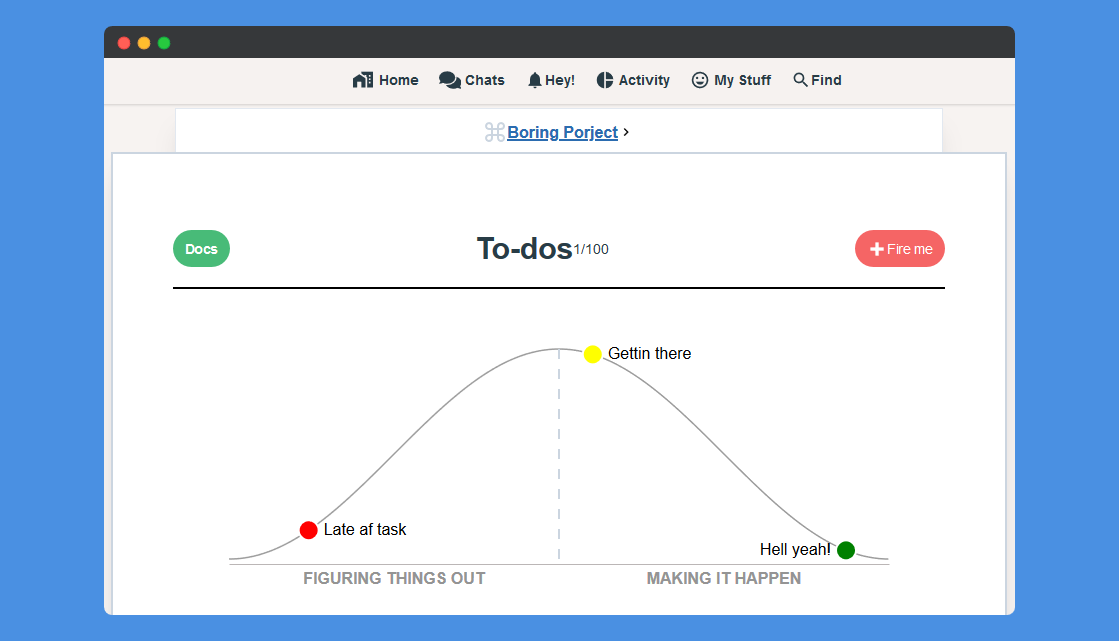
Basecamp's hill chart implementation using D3.js, Try the demo


![]()
![]()
Features
- Implemented in pure ES6/JS using D3.js
- Customizable
- Tested (kinda 😅)
- Easily wrapped and integrated into other UI frameworks
- Dark mode by @jeffandersen
Getting started
Install using yarn
yarn add hill-chart
using npm
npm i hill-chart
Or Using CDN
Chart styles ~ 1kb
<link
  rel="stylesheet"
  href="https://unpkg.com/hill-chart@latest/dist/styles.css"
/>
the whole bundle including d3js ~ 48kb (16kb gizp)
<script src="https://unpkg.com/hill-chart@latest/dist/hill-chart.umd.js"></script>
Or if you prefer D3js and hill-chart separate bundles
Custom d3js only minified ~ 41kb (14 gizp)
<script src="https://unpkg.com/hill-chart@latest/dist/d3.min.js"></script>
hill chart only minified ~8kb (2kb gzip)
<script src="https://unpkg.com/hill-chart@latest/dist/hill-chart.nod3.umd.js"></script>
Usage
make sure to have empty with an id or class
<svg class="hill-chart" />on your domdefine some points
// if dont want to use cdn
import 'hill-chart/dist/styles.css';

import HillChart from 'hill-chart';

const data = [
  {
    id: '3' // (optional)
    color: 'red',
    description: 'Late af task',
    size: 10,
    x: 12.069770990416055,
    y: 12.069770990416057,
    link: '/fired.html',
  },

  {
    id: '1' // (optional)
    color: 'yellow',
    description: 'Gettin there',
    size: 10,
    x: 55.11627906976744,
    y: 44.88372093023257,
  },
  {
    id: '2' // (optional)
    color: 'green',
    description: 'Hell yeah!',
    x: 93.48837209302326,
    y: 6.511627906976724,
    size: 10,
  },
];
- (optional) define options
const config = {
  target: '.hill-chart',
  width: 700,
  height: 270,
  preview: false,
};
const hill = new HillChart(data, config);
hill.render();

hill.on('move', (x, y) => {
  console.log(`x: ${x}`);
  console.log(`y: ${y}`);
});
Config (Object)
All default config can be override by passing config object to the HillChart instance.
const config = {
  target: 'svg', // element selector it could be class, id, or svg element on page but it has to be an <svg /> element
  width: 900, // chart width
  height: 300, // chart height
  preview: false, // if true points wont be draggable
  darkMode: false, // Whether the dark color scheme is to be used
  backgroundColor: 'transparent', // Color to be used as bg, Use true for default color
  footerText: {
    // control footer text
    show: true,
    fontSize: 0.75, // in rems
  },
  margin: {
    // the margins of the inner chart from the svg frame
    top: 20,
    right: 20,
    bottom: 40,
    left: 20,
  },
};
Data (Array)
You can define as may points as you want as long as the it have these options
data: [
  {
          id: 'd4f4sd', // (optional) any unique id, if not provided it'll be auto generated for you.
          color: 'red', // color of the point it can be named color 'blue', 'red' or hex #000fff, #cccccc
          description: 'Late af task', // text next to the point, it's recommended to keep it short
          size: 10, // (optional) default size of the point
          x: 12.069770990416055, // x coordinates, (optional, defaults to 0) avoid setting it manually
          y: 12.069770990416057, // y coordinates, (optional, defaults to 0) avoid setting it manually
          link: '/fired.html', // (optional, defaults to '#') if in preview mode point became clickable
  }
],
Events
Name: Move
Trigger: .on('move', (x, y)=>{})
triggered: while point being dragged
payload: the point's new coordinates
Pro tip: you may use this event to store points in the database
Name: Moved
Trigger: .on('moved', (data)=>{})
triggered: after point dragged
payload: the point's data object with new coordinates
Name: Home
Trigger: .on('home', (data)=>{})
triggered: if the point hit 0 on X axis
payload: the point's data object
Name: End
Trigger: .on('en', (data)=>{})
triggered: if the point hit last point on X axis
payload: the point's data object
Name: pointClick
Trigger: .on('pointClick', (data)=>{})
triggered: when clicked on the point
payload: the point's data object
Contributing
To get started...
- Take a quick look on Todo List
- Open issue to share and discuses new ideas or features.
Step 2
- Fork this repo!
- Install dev dependencies
- Create new branch describes the new feature/bug.
- Do your thing :)
Step 3
- Be sure to include coverage tests for your awesome idea
- Submit a new pull request
Todo List
- Refactor this nasty
drag()event handler - Add more test. (depends on
drag()refactoring) - Add more events, or improve the existence ones
- Add dev server/watcher
- Extract to vue components
- Feature add snow ball effect, add option to increase the point size gradually near the end.
- Improve the demo
- Add SSR demo
- Fully extract d3 modules
- Update rollup config bundles
D3 testing problems
I tried my best to unit test every use case. It seems that d3js have issues regards event handling in a test environment specially with jest, add on top of this babel which has trouble importing a mutable field from d3 using the import / export syntax.
Theory
If you are wondering, don't be afraid to look under the hood.
Every Step is well documented
- Start from here src/helpers.js
- then here src/index.js
Inspiration (credits)
🛑 Copyright notice
Hill chart is an original idea by Basecamp. While this project aims to replicate the behavior and/or the design of the mentioned idea, it isn't by any means an attempt to reclaim the credit of the idea nor the design.