README
benchart
![]()

![]()


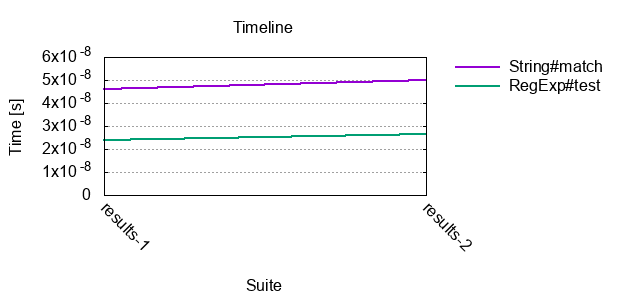
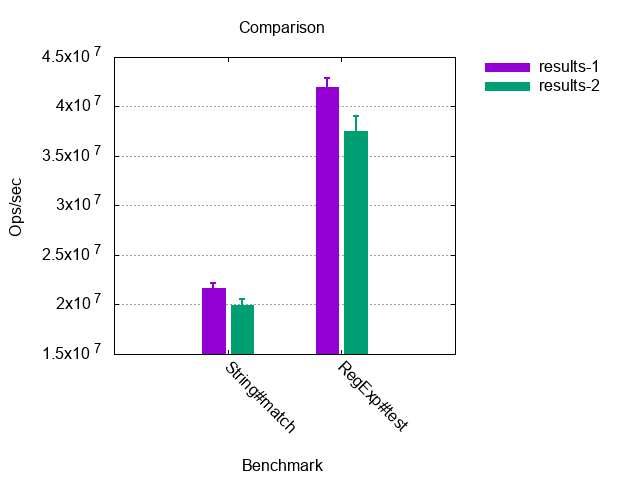
Plots a performance chart for Benchmark.js results saved by astrobench-cli.
Pre-requisites
Chart generation requires gnuplot installed. It is freely available on any platform.
On Linux, install from the distribution package. For example, on Ubuntu:
sudo apt install gnuplot
Using Homebrew on OSX:
brew install gnuplot
Using Chocolatey on Windows:
choco install gnuplot
Getting Started
Make sure that you have Node.js >= 10 installed. Install benchart globally:
npm i -g benchart
Plot a performance chart for all results in a directory:
$ benchart results
Testing Scenario
Testing page:
<link rel="stylesheet"
      href="https://unpkg.com/@prantlf/astrobench@1.1.0/dist/astrobench.min.css">
<script src="https://unpkg.com/@prantlf/astrobench@1.1.0/dist/astrobench.min.js"></script>

<div id="astrobench"></div>

<script>
  suite('A suite', suite => {
    const text = 'Hello world'
    bench('Validate greeting by regular expression', () => text.match(/^H/))
    bench('Validate greeting by comparison', () => text[0] === 'H')
  })
</script>
Tool installation:
npm i -g astrobench-cli benchart
Chart generation:
$ astrobench -j output/results.json example/index.html
$ benchart output
Command-Line Usage
The benchart script plots a chart for statistics produced by Benchmark.js and written out to JSON files by astrobench-cli.
$ benchart --help

Usage: benchart [options] <directory>|<file> ...

Options:
  -V, --version               output the version number
  -d, --out-directory <path>  path to the output directory
  -n, --out-name <name>       file name of the written chart (default: "chart")
  -p, --type <type>           type of the chart (default: "timeline")
  -t, --title <title>         chart title (default: "Benchmark Results")
  -w, --width <number>        width of the charter in pixels
  -g, --height <number>       height of the charter in pixels
  -i, --y-min <number>        minimum value on the y axis
  -a, --y-max <number>        maximum value on the y axis
  -y, --y-property <name>     property shown on the y axis (default: "hz")
  -r, --error-bars            show standard error of the mean
  -b, --x-label <label>       label of the x axis
  -e, --y-label <label>       label of the y axis
  -c, --cluster-by <input>    cluster histogram bars
  -l, --legend-place <place>  legend placement (default: "outside")
  -v, --verbose               print progress of the plotting
  -h, --help                  output usage information

 Reads all "*.json" files from the specified directory, unless a list of
 files is specified. The chart will be written to the input directory,
 unless an output directory is specified. Chart types are "timeline" or
 "comparison". Histograms can be clustered by "benchmark" or "suite".
 Legend places are "left", "right", "outside" and "under". Property shown
 on the y axis can be "hz" or "mean".

Examples:

 $ benchart results
 $ benchart -rv -t "Sizes" -d results -n comparison \
     -p comparison results/50.json results/100.json
Programmatic Usage
Make sure that you have Node.js >= 10 installed. Install benchart locally in your project with npm or yarn:
npm i benchart
yarn add benchart
Plot a chart for all JSON files in the results directory and store it with the name chart in the same directory:
const plot = require('benchart')
await plot({ directory: 'results' })
plot(options: object): Promise<>
The main module exports a function which generates the chart to the output directory and returns a Promise resolved when the chart has been written.
Recognised options:
directory: string- directory to look for the input JSON filesout-directory: string- path to the output directoryout-name: string- file name of the written chart (default: "chart")type: string- type of the chart (default: "timeline", otherwise: "comparison")title: string- chart title (default: "Benchmark Results")width: number- width of the charter in pixelsheight: number- height of the charter in pixelsy-min: number- minimum value on the y axisy-max: number- maximum value on the y axisy-property: string- property shown on the y axis (default: "hz", otherwise: "mean")error-bars: boolean- show standard error of the mean (default:false)x-label: string- label of the x axisy-label: string- label of the y axiscluster-by: string- cluster histogram bars by "benchmark" or "suite"legend-place: string- legend placement (default: "outside", otherwise: "left", "right", and "under")verbose: boolean- print progress of the plottingverbose: boolean- print progress of the chart generation (default:false)
Data
An example of a JSON file with test results. Benchmark properties aborted, error, hz, stats and times are described in the Benchmark.js documentation:
[
  {
    "name": "A suite",
    "benchmarks": [
      {
        "name": "String#match",
        "aborted": false,
        "hz": 21672040.42791444,
        "stats": {
          "rme": 1.394724557215958,
          "mean": 4.2691777736331135e-8
        }
      },
      {
        "name": "RegExp#test",
        ...
      },
      {
        "name": "Benchmark with error",
        "error": {
          "message": "text is not defined",
          "name": "ReferenceError",
          "stack": "@test/example/bench.js:19:6
            Benchmark.uid1580598679888createFunction@test/example/index.html:3:124"
        },
        "aborted": true
      }
    ]
  }
]
Contributing
In lieu of a formal styleguide, take care to maintain the existing coding
style. Add unit tests for any new or changed functionality. Lint and test
your code using npm.
License
Copyright (c) 2020 Ferdinand Prantl
Licensed under the MIT license.