README
D3 Ternary Plot
![]()
d3-ternary is a JavaScript library and D3.js module that makes it easy to create ternary plots, its API exposes configurable functions in the manner of other D3 modules.
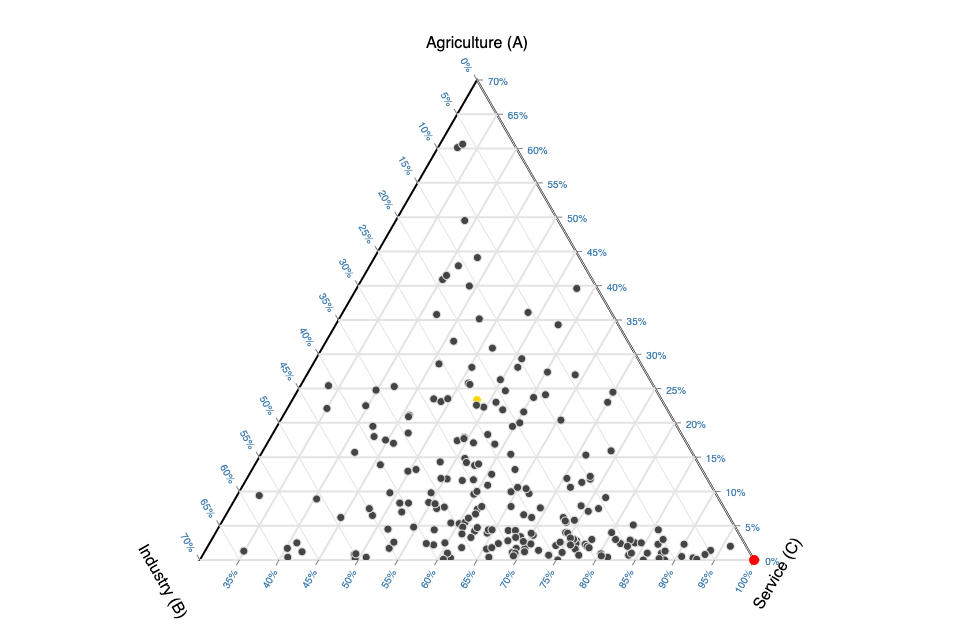
Ternary plots are a type of triangular diagram that depict components proportions in three-component systems. Each point in the triangle corresponds to a unique composition of those three components.
Try d3-ternary your browser, view the introductory notebook on Observable and see the 'Ternary Plots' notebook collection for examples. Or make ternary plots in the browser on TernaryPlot.com which is built using d3-ternary.
Installing
If you use npm
npm install d3-ternary
For yarn
yarn add d3-ternary
You can also download the latest release on GitHub. For vanilla HTML in modern browsers, import d3-ternary from Skypack:
<script type="module">

import {barycentric, ternaryPlot} from "https://cdn.skypack.dev/d3-ternary@2";

const b = barycentric();
const t = ternaryPlot(b);

</script>
For legacy environments, you can load d3-ternary’s UMD bundle from an npm-based CDN such as jsDelivr or unpkg; a d3 global is exported:
<script src="https://cdn.jsdelivr.net/npm/d3-array@3"></script>
<script src="https://cdn.jsdelivr.net/npm/d3-scale@4"></script>
<script src="https://cdn.jsdelivr.net/npm/d3-ternary@2"></script>
<script>

const b = d3.barycentric();
const t = d3.ternaryPlot(b)

</script>
API Reference
barycentric()
barycentric() <>
Constructs a new default ternary converter that converts ternary data to Cartesian coordinates. By default, it makes an equilateral triangle on the unit circle centered at the origin.
Computes [x,y] coordinates from a ternary values (a single three-element array). Note that the [x, y] coordinates here are unscaled (radius of 1). All values are normalized by default.
# barycentric.invert(coordinates) <>
Computes ternary values from coordinates (a two-element array [x, y]). Note that the [x, y] coordinates here are unscaled i.e. a radius of 1.
If a is specified, sets the a-accessor to the specified function and returns this barycentric converter. If a is not specified, returns the current a-value accessor, which defaults to:
const a = (d) => d[0];
If b is specified, sets the b-accessor to the specified function and returns this barycentric converter. If b is not specified, returns the current b-value accessor, which defaults to:
const b = (d) => d[1];
If c is specified, sets the c-accessor to the specified function and returns this barycentric converter. If c is not specified, returns the current c-value accessor, which defaults to:
const c = (d) => d[2];
# barycentric.normalize(ternaryData) <>
Computes normalized ternary values by summing the of ternary data and taking proportions of it using the value accessors.
# barycentric.vertices([vertices]) <>
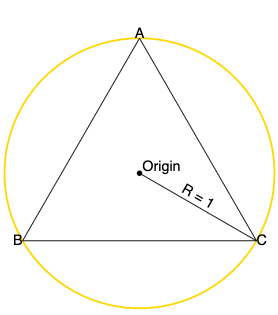
If vertices is specified, sets the vertices to the specified array and returns this barycentric converter. If vertices is not specified, returns the current vertices, which defaults to the vertices of an equilateral triangle with radius 1 with angles -90°, 150°, 30°.
The following diagram makes it more clear
ternaryPlot()
ternaryPlot(barycentric) <>
Constructs a new default ternary plot generator with the default options.
Computes [x, y] coordinates that are scaled by the plot radius from ternary data. Unlike the barycentric method, this method takes the plot radius into account.
# ternaryPlot.invert(coordinates) <>
Computes ternary values from [x, y] coordinates that are scaled by the radius. Unlike the barycentric.invert() method this method takes the plot radius into account. Note that for inverting mouse positions, the ternary plot should centered at the origin of the containing SVG element.
Configuration methods
# ternaryPlot.radius([radius]) <>
If radius is specified, sets the radius of the ternary plot to the specified number. If radius is not specified, returns the current radius, which defaults to 300 (px).
# ternaryPlot.domains([domains]) <>
If domains is specified, sets the domains of the ternary plot to the specified domains in order [A, B, C] and checks if the supplied domains are reversed. If this is the case, reverseVertices() is called. The scale and translation offset associated with the domains are applied to correctly scale and translate the plot. At last it returns the ternary plot.
If domains is not specified, returns the current domains, which defaults to [[0, 1], [0, 1], [0, 1]].
To set domains without these extra checks, use ternaryPlot.setDomains(domains).
# ternaryPlot.vertices([vertices]) <>
If vertices is specified, unscales vertices and sets the vertices of the barycentric() function passed to ternaryPlot(). If vertices is not specified, return the current scaled vertices.
Layout methods
# ternaryPlot.labels([labels]) <>
If labels is specified, sets the axis labels to the labels in order of [A, B, C] and returns the ternary plot. If labels is not specified, returns the current labels, which defaults to [[A, B, C]].
# ternaryPlot.labelAngles([angles]) <>
If angles is specified, sets the angles of the axis labels to the specified angles in order of [A, B, C] and returns the ternary plot. If angles is not specified, returns the current label angles, which defaults to [0, 60, -60]
# ternaryPlot.labelOffsets([offsets]) <>
The label offset is the spacing of the label to the vertex in pixels. If offsets is specified and is an array, sets the axis label offsets to the specified angles in order of [A, B, C] and returns the ternary plot. If offsets is a number, sets the label offsets of all axes to offsets. If offsets is not specified, returns the current label offsets, which defaults to [45, 45, 45] px.
# ternaryPlot.tickAngles([angles]) <>
If angles is specified, sets the angle of the ticks of each axis to the specified angles in order [A, B, C] and returns the ternary plot. If angles is not specified, returns the current tick angles, which defaults to [0, 60, -60].
# ternaryPlot.tickTextAnchors([textAnchors]) <>
If textAnchors is specified, sets the axis tick text-anchor to the specified text-anchors in order of [A, B, C] and returns the ternary plot. If textAnchors is not specified, returns the current tick text-anchors, which defaults to ["start", "start", "end"].
# ternaryPlot.tickSizes([sizes]) <>
If sizes is specified and is an array, sets the axis tick sizes to the specified tick sizes in order of [A, B, C] and returns the ternary plot. If sizes is a number, sets the tick sizes of all axes to sizes. If sizes is not specified, returns the current tick sizes, which defaults to [6, 6, 6] (px).
# ternaryPlot.tickFormat([format]) <>
If format is specified, sets the tick format. format can either be a format specifier string that is passed to d3.tickFormat(). To implement your own tick format function, pass a custom formatter function, for example const formatTick = (x) => String(x.toFixed(1)). If format is not specified, returns the current tick sizes, which defaults to "%", meaning ticks are formatted as percentages.
Plot Methods
Generates and return an array of arrays containing each grid line objects. If counts is not specified, it defaults to 20. Counts can be a number or an array of numbers, one for each axis in order of [[A, B, C]] . Each array contains counts elements of two-element arrays with the start- and end coordinates of the grid line in two-element arrays.
Grid lines are generated using d3.scale.ticks(). The specified count is only a hint; the scale may return more or fewer values depending on the domain.
Generates and return an array of tick objects for each axis. If counts is not specified, it defaults to 10. Counts can be a number or an array of numbers, one for each axis in order of [A, B, C].
Each tick object contains the following properties
tick: The formatted tick textposition: An array of x, y coordsangle: The tick rotationsize: The length of the tick
Ticks are generated using d3.scale.ticks(). The specified count is only a hint; the scale may return more or fewer values depending on the domain.
# ternaryPlot.axisLabels([{center: false}]) <>
Generates and return an array containing axis label objects. Each axis label object contains the following properties.
position: an array of [x,y] coordslabelAngle: the rotation of the axis labellabel: The axis label
Takes an optional configuration object that specifies whether axis labels should be placed at the center of the axis, the default is false.
ternaryPlot.axisLabels({ center: true });
Returns an SVG path command for a the outer triangle. This is used for the bounds of the ternary plot and its clipPath.
Methods for handling zooming, panning
These methods are used internally for _ternaryPlot*.domains(), and can be used to handle interactivity like zooming and panning. See Introducing-d3-ternary: Zooming for an example of this. Other than that, best not to touch these really.
# ternaryPlot.translate([scale]) <>
If translate is specified, sets the plot’s translation offset to the specified two-element array [tx, ty]. Note that these are unscaled by the radius. Then it applies the transform and returns the ternary plot. If translate is not specified, returns the current translation offset which defaults to [0, 0].
Note when setting the translation, the offsets should not be scaled by the plot radius.
# ternaryPlot.scale([scale]) <>
If scale is specified, sets the plot’s scale factor to the specified value, applies the transform and returns the plot. If scale is not specified, returns the current scale factor, which defaults to 1.
The scale factor corresponds inversely to the domain length. For example a domains of [[0, 0.5], [0, 0.5], [0.5, 1] corresponds to a scale of 2.
Applies the plot's scale factor and translations to the plots barycentric() conversion function. Or more simply, calling this method moves and scales the triangle defined by barycentric() used to calculate the ternary values.
Before scale and translation are applied, they are checked if they are within bounds, if not, a correction is applied such that they are within bounds. Finally, the ternary plot is returned.
# ternaryPlot.reverseVertices() <>
Swaps the vertices so reversed domains are displayed correctly. ternaryPlot.domains() checks wether the domains are reversed and calls this method if so. You'll rarely need to call this method directly.
# ternaryPlot.transformFromDomains(domains) <>
Computes the scale and translation for the given domains and returns a transform object containing scale k, and translation offsets x, and y. This is used to sync the zoom and pan of the plot to the specified domains set by .domains(). You'll rarely need to call this method directly.
Note that the translation returned here is unscaled by radius.
# ternaryPlot.domainsFromVertices() <>
Computes and returns the domains corresponding to the current transform. This is used for syncing domains while zooming and panning.
# ternaryPlot.setDomains(domains) <>
Sets the domains in order [[A, B, C]]. This method is needed when setting domains that are returned by ternaryPlot.domainsFromVertices() while zooming and panning. Usually ternaryPlot.domains() is the preferred method for setting domains.
Future work
- Improve transform method, right now it's a hacky, bug-prone piece of work made through trial and error.
- Add JSDoc docstrings
- Canvas support
- Support for ternary binning
- More and better tests
- Jupyter Notebook integration
Acknowledgments
Several projects have served as a starting point for this module.
- The initial d3-ternary module by Daven Quinn
- Ternary slider notebook by Yuri Vishnevsky
- D3 Ternary Plot notebook by Torben Jansen
- Zoomable Ternary Plot notebook by dixonj13
All authors are thanked.