README
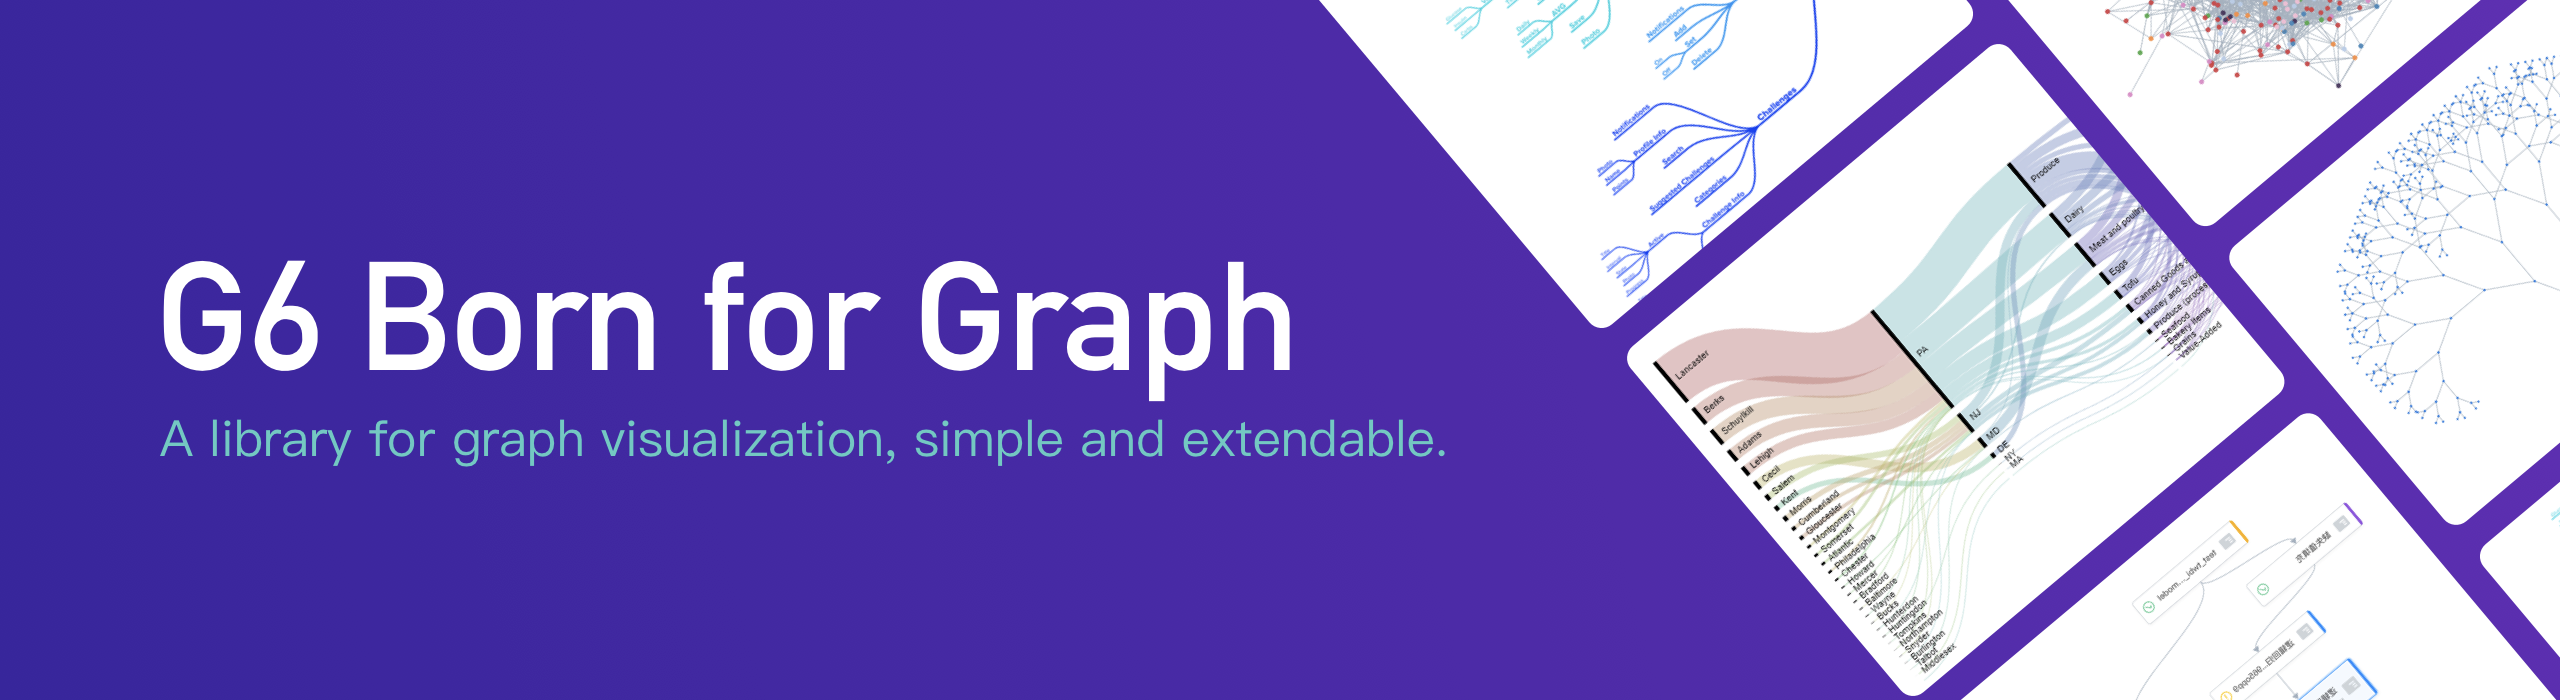
G6: A Graph Visualization Framework in TypeScript.

![]()
![]()
![]()


![]()
G6 is a graph visualization framework which provides a set of basic mechanisms, including rendering, layout, interaction, animation, analysis, and other auxiliary tools. Developers are able to build graph visualization analysis applications or graph visualization modeling applications easily. For more details, please see our doc.


Installation
$ npm install @antv/g6
Usage

import G6 from '@antv/g6';

const data = {
  nodes: [
    {
      id: 'node1',
      x: 100,
      y: 200,
    },
    {
      id: 'node2',
      x: 300,
      y: 200,
    },
  ],
  edges: [
    {
      target: 'node2',
      source: 'node1',
    },
  ],
};
const graph = new G6.Graph({
  container: 'mountNode',
  width: 500,
  height: 500,
  defaultNode: {
    type: 'circle',
    style: {
      fill: '#40a9ff',
      stroke: '#096dd9',
    },
  },
  nodeStateStyles: {
    hover: {
      lineWidth: 3,
    },
    select: {
      lineWidth: 5,
    },
  },
});
graph.data(data);
graph.render();
Development
$ npm install

# run test case
$ npm run test-live

# build watching file changes and run demos
$ npm run dev
How to Contribute
Please let us know how can we help. Do check out issues for bug reports or suggestions first.
To become a contributor, please follow our contributing guide.