README
ioBroker.photovoltaikcharts


Tests: ![]()
VIS widgets for drawing charts especially for photovoltaic production and consumption data with highcharts
To use the charts one of the history adapters is required: history, sql or InfluxDB. The two Time Series charts with Navigator currently only work with SQL adapter and MariaDB/mysql. Here I use special SQL queries to significantly reduce the amount of data already in the DBMS. Otherwise, a navigator with a time series with values every 10 seconds and more than one year would not be possible.
I developed this adapter to be able to display the data of my photovoltaic system in an appealing way. The generation and consumption data are processed by the statistics adapter and a time series is created using the values in the save area with the SQL adapter. The charts each use the last value of the set time unit to obtain the final value saved by the statistical adapter. This is necessary because the history adapters sometimes create additional entries in the time series when they are stopped and started, but these still contain the value of the previous period.
In addition, the ID of the corresponding value from the temp range can be specified. In this case, the current value is additionally displayed and continuously updated.
In addition to the charts for values from the statistical adapter, there are two types of time series that can be used generically.
All charts update automatically.
The widgets contain many parameters for setting step, stacking, y-axis, etc. The parameters are described at https://api.highcharts.com/.
Chart types
Chart for anual values
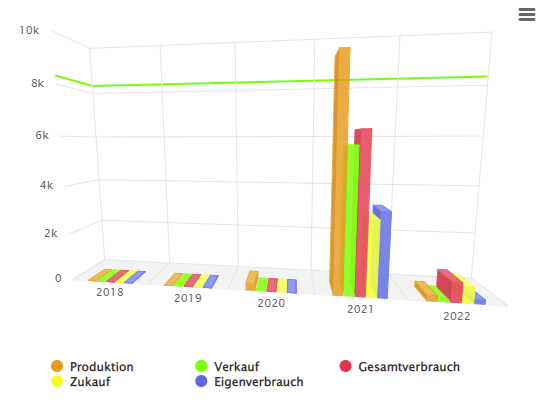
This 3D chart shows up to 5 comparative values for the last 5 years. The value for the current year is updated continuously. Enter the ID for statistics.0.save.sumDelta.xxx.year as the ID of the data series and the ID for statistics.0.temp.sumDelta.xxx.year as the ID for the current values.
If a number is entered under Target value, a line is also displayed.
Chart for monthly values
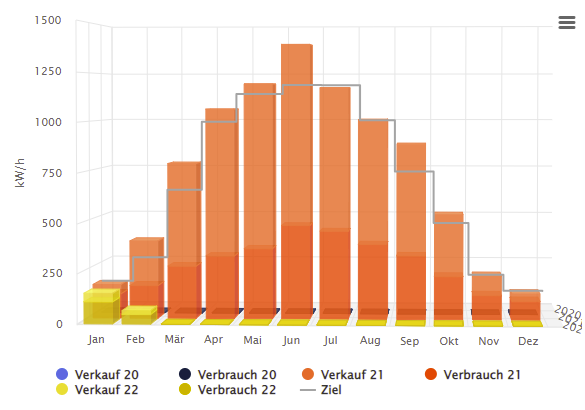
This chart shows the monthly values of two data series, each as a stack for the last 3 years. Enter the ID for statistics.0.save.sumDelta.xxx.month as the ID of the data series and the ID for statistics.0.temp.sumDelta.xxx.month as the ID for the current values.
A comma-separated list of target values can be entered under Target Value. These are shown as a grey line.
Chart for time series of statistic adapter
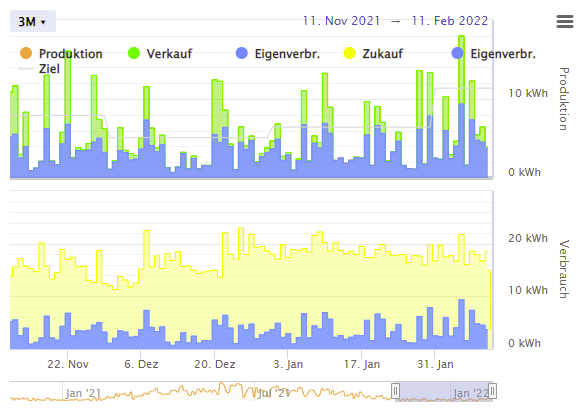
Displays time series based on the data of the statistics adapter. Also in this case, both the save values and the temp values are used. It can be used flexibly for hours, days, months, weeks and years.
The first ID is also used for the navigator. The series can be assigned to the two y-axes and stacked as desired.
Chart for time series of normal history data with navigator
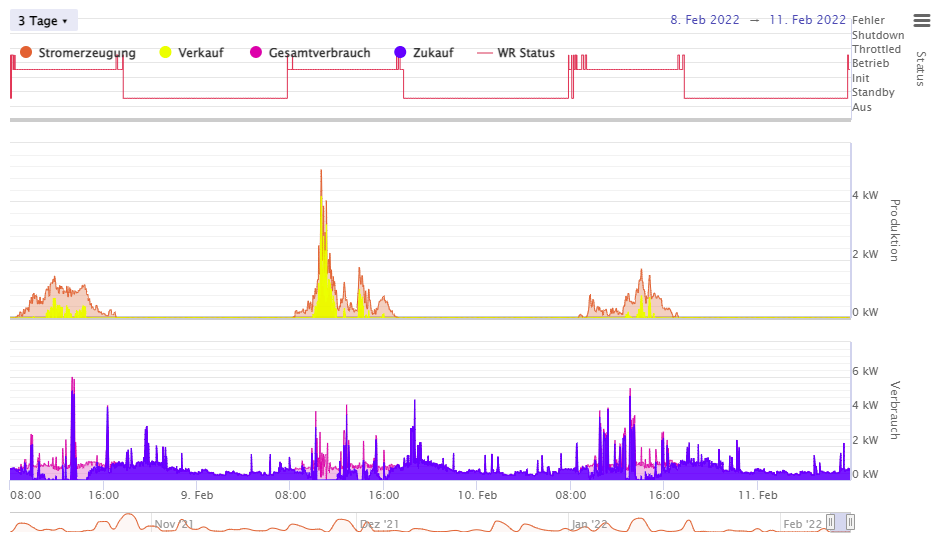
This diagram represents time series. These do not have to be based on the statistics adapter. The chart has fixed 3 y-axes and a navigator independent of the data series. The data series can be freely assigned to the axes and stacked. Categories can also be defined as JSON, which replace numerical values.
Chart for time series of normal history data without navigator
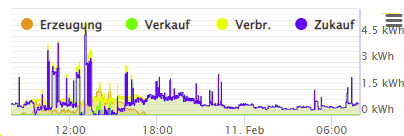
Diagram for time series with a Y-axis and without navigator. Replaces all the diagrams I had previously created with Flot.
How to use
- install "vis"-adapter and create one instance if not installed.
- install this adapter
After this, the new widgets should be offered in the VIS editor. All settings are made directly in the widget.
Why highcharts
For iobroker, there are already several chart solutions that generate configurable charts with the history data. Unfortunately, there is no special support for time series on values of the statistical adapter and display of the current value.
Of course, the existing chart solutions can be extended for this purpose, but the generic charts are still rather suboptimal for my special use case. Especially with photovoltaic systems, one does not only want to look at the monthly or annual values of the current year, but to compare them directly with the corresponding values of the previous years. However, this is almost impossible with the generic adapters. At the latest when it comes to using the charts in the Cordova app, I don't really like any of the existing solutions. Flot does use the socket io connection from vis, but this becomes slow with more than one chart. The widget from the echarts adapter would have to be completely rewritten so that it also works with the app via a reverse proxy.
You could also implement the diagrams with a completely free chart library, but from a purely visual point of view, highcharts is in a different league. In addition, it should also be possible to directly access data from far back in the VIS view. Highstock offers a very smart solution for this with the integrated Navigator.
Restrictions
The widgets still have development status.
The time series support zoom and pinch (with shift key), mouse wheel as well as multi-touch gestures. Extensions exist for this, which should also allow this with dynamic loading of data. This is still experimental. Especially with several quick gestures one after the other, the reloading does not follow and can lead to display errors.
The input fields do not all have format checks. Numbers should be entered with a dot (1.2). Some fields require input in JSON format, e.g. to pass categories or value lists. Again, there is no format check in the editor.
Changelog
1.0.8 (2022-02-17)
- Use groups for dynamic configuration
- more config options
1.0.7 (2022-02-15)
- fix pinch zoom
- fix dynamic update behaviour on zoom
- adopted navigator sql statements
- add bar and column types
1.0.6 (2022-02-13)
- Fix js paths because vis only supports 2 levels
1.0.5 (2022-02-12)
iobroker app compatibility
The widgets works perfect in my self compiled version of the iobroker cordova app for android. The widgets only use the socket io connection from VIS. Only the export functions of highcharts do not work under Cordova.
However, due to licensing restrictions on the commercial use of highcharts, it is unlikely that this adapter will be included in the official Android app.
License
This adapter based on highcharts and highstock. These are commercial products, which require to obain a appropriate licence. Please check https://www.highcharts.com/license for licensing. Non commercial use of highcharts and highstock is currently free under a Creative Commons (CC) Attribution-Non-Commercial license.
During the installation of this adapter the npm package highcharts will automaticaly downloaded and the required files are copied to the widget directory.
Copyright (c) 2022 nobodyMO