README
![]()
leaflet-topography
a set of tools for calculating and visualizing topography in leafletjs
👀 Demo 👀
Leaflet-topography is a leaflet plugin which offers functions and layers for calculating and visuzalizing topographic data in a leaflet map. These tools are based on the Mapbox RGB Encoded DEM, which means you must use your mapbox access token to use these tools.
Why?
While other tools exist to calculate and visualize topography in leaflet, this package is designed to do so at lightning speed. Under the hood, leaflet-topography uses your mapbox token to fetch the Mapbox-RGB-Terrain tile associated with your latlng, and it then performs calculations to return elevation, slope, and aspect for that location. The point's associated DEM tile is cached in the format and location of your choice. This means that further queries that fall in the same tile return topography data quickly, without the need for another network request. For a detailed explanation of how this works, you can read my article, "Slope and Aspect as a Function of LatLng in Leaflet"
Installation and Use
You can install leaflet-topography through npm:
npm i leaflet-topography
Or you can include the package in your HTML head using unpkg:
<head>
   <script src="leaflet-CDN-comes-first" type="text/javascript"></script>
   <script src="https://unpkg.com/leaflet-topography" type="text/javascript"></script>
</head>
leaflet-topography will attach to the leaflet global L, and L.Topography will now be available for use. You can also import relevant tools directly:
import Topography, { getTopography, configure, TopoLayer } from 'leaflet-topography'
Tools:
getTopography

This is leaflet-topography's central tool. This async function takes in an L.LatLng object, and a semi-optional configuration object, and returns a promise which resolves to the result, which contains elevation, slope, and aspect data for that latlng. You can use async / await syntax, or .then syntax:
import Topography from 'leaflet-topography'

const map = L.map('mapdiv', mapOptions));

const options = {
  token: 'your_mapbox_access_token'
}

// async / await syntax
map.on('click', async (e) => {
  const results = await Topography.getTopography(e.latlng, options);
});

// promise .then syntax
map.on('click', (e) => {
  Topography.getTopography(e.latlng, options)
    .then((results) => console.log(results));
});
Results are returned with the following units:
| result | unit | range |
|---|---|---|
elevation |
meters relative to sea level | -413 to 8,848 (Dead Sea to Mt Everest) |
slope |
degrees | 0 - 90 (flat to vertical cliff) |
aspect |
degrees in polar coordinates (0 due east increasing counterclockwise) | 0 - 360 |
resolution* |
meters | less than 1 to greater than 20,000,000 |
(*Resolution is a metadata value describing roughly how large the area used to calculate slope and aspect is. Slope and aspect are calculated based on a latlng's 4 neighboring pixels. Higher scale values have smaller distances between pixels, so the neightbors are closer together, and the resolution is better. Higher spread values mean skipping more pixels to choose a neighbor, which worsens resolution. Larger resolution in this context means the surface being measured is more "smoothed out".)
Options
You must pass an options as the second argument of getTopography, or you can use the configure function to preconfigure leaflet-topography.
| Option | Type | Default | Description |
|
token required* |
string |
none | Mapbox token, required to retrieve mapbox tiles used in calculations. Not required when using tilesUrl |
| scale | number |
15 | Zoom level of retrieved tiles. Using a lower scale will give slope and aspect calculations with lower resolution. Not recommended to use scale less than 12, values greater than 15 not possible |
| spread | number |
2 | Number of pixels away from queried point to use for calculations. Larger numbers give lower resolution and "smooth" the surface being measured. If you are using a spread > 10 you should consider simply lowering your scale. |
| priority | 'speed' | 'storage' |
'storage' | Priority used by the getTopography algorithm. When prioritizing speed, retrieved tile data is cached as an ImageData Uint8ClampedArray. Retrieving pixel data from cached Uint8ClampedArrays is very fast, but each Uint8ClampedArray takes up almost 3 megabytes of in-browser memory. Prioritizing storage will cache tile data as an ImageBitmap, which requires about 40 bytes of storage per bitmap. However, retrieving pixel data from an ImageBitmap requires calling drawImage and getImageData, which is slightly slower. Difference will not be noticeable when requesting topography one point at a time, but can make a big difference when querying hundreds of points in a small area in a small amount of time. |
| saveTile | function |
(name, tileData) => { L.Topography._tileCache[name] = tileData } |
Custom function provided by the user to define tile-cacheing behavior. Must take the form function(name: string, tileData: ImageData | ImageBitmap) => void. See the cacheing tiles section for more information. |
| retrieveTile | function |
(tileName) => L.Topography._tileCache[tileName] |
Custom function provided by the user to define where to retrieve tile data from. Must take the form function(name: string) => tileData: ImageData | ImageBitmap. See the cacheing tiles section for more information. |
| tilesUrl | string |
none | Optional url for custom tiles to be used instead of Mapbox rgb-terrain. Must be in the standard slippymap tilename format. 👁 See demo project here 👁 (Note this demo relies on custom tiles that may no longer be available by the time you read this). |
| heightFunction | function |
function(R, G, B) => -10000 + (R * 256 * 256 + G * 256 + B) * 0.1 |
Optional override function for calculating elevation value based on a pixel's RGB value. Must be in the format of function(R: number, G: number, B: number) => number |
Cacheing Tiles
The key feature of leaflet-topography that enables returning topography data for high volumes of points in the same area in a short time is its data-cacheing behavior. Note the loose use of the word 'cache' - it is really in-memory storage. The default behavior is to simply store the DEM tiles in an object, with the key being the tile name in the format X<X>Y<Y>Z<Z>, and the value being the data, either as a Uint8ClampedArray or an ImageBitmap. By default, the tiles are stored in L.Topography._tileCache. However, you have the option to define your own cacheing functions to store the tiles wherever you like. You can use the saveTile and retrieveTile options to do this. For example, if you wanted to store the tiles on the window object instead (not recommended), you could do this:
import { configure } from 'leaflet-topography'

const mySaveFunction = (name, data) => { window.myTemporaryCache[name] = data }
const myRetrieveFunction = (name) => return window.myTemporaryCache[name]

configure({
   safeTile: mySaveFunction,
   retrieveTile: myRetrieveFunction
})
And now your tiles will be saved to and retrieved from the window.myTemporaryCache object. There are many in-browser data storage options, and these functions can be adapted to work with the storage method of your choice.
TopoLayer
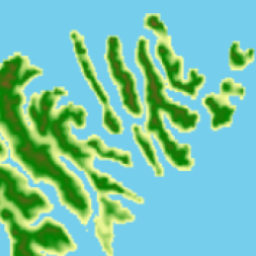
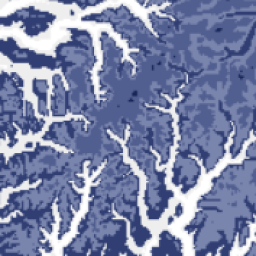
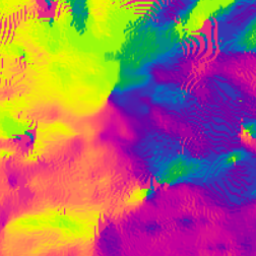
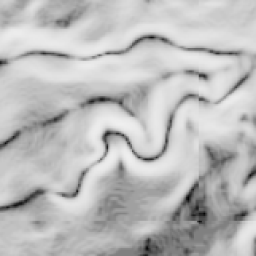


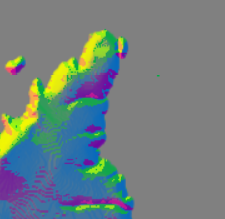
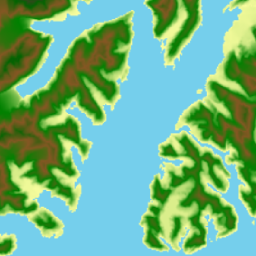
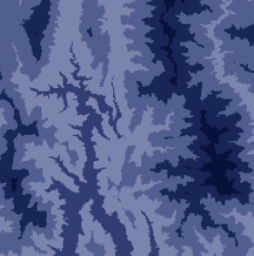
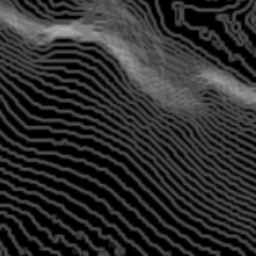
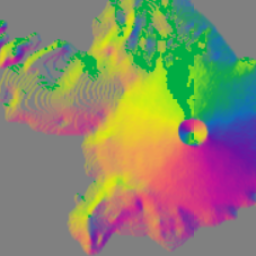
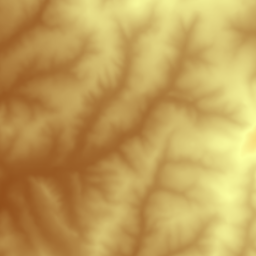
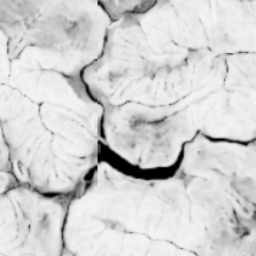
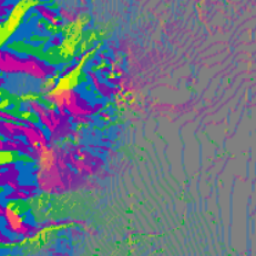
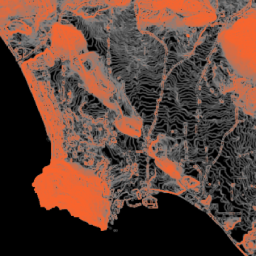
The TopoLayer constructor will build a new tile layer, derived from the Mapbox RGB Terrain tileset. Using web workers and RainbowVis.js, a TopoLayer transforms the rgb DEM to visualize topographic features. All of the thumbnails above were generated with variations of a TopoLayer. It takes a configuration object as the contructor's argument:
import { TopoLayer } from 'leaflet-topography'

const elevationLayer = new TopoLayer({
  topotype: 'elevation',
  token: 'your_mapbox_token'
  customization: <customization_options>
});

elevationLayer.addTo(map)
Constructor Options
| Option | Type | Description |
|
topotype required |
string |
Type of topography to render. Can be one of `elevation`, `slope`, `aspect`, or `slopeaspect`. |
|
token required |
string |
Mapbox access token. Can be omitted if it was already used in the configure function. |
| customization |
object
|
Customization object that allows you to customize the color choice and distribution of the TopoLayer. See below for details. |
Customization Options
The optional customization object allows you to customize the way colors are rendered. It takes the following options, all of which are optional:
| Option | Type | Description |
| colors | Array<string> hex color value |
You can pass an array of hex color values to choose the colors rendered by the workers, mapped to the breakpoints you define |
| breakpoints | Array<number> |
Determines how colors are spread across values. Should span the range of possible values of results. If you provide colors without providing breakpoints, the breakpoints will be generated evenly for you across the topotype's range. |
| continuous | boolean |
Determines if color should be a continuous gradient, or render in class breaks according to whether or not the topo value falls in the breakpoint range
|
| breaksAt0 | boolean |
Only relevant to topotype: 'elevation'. Determines whether or not to inject a breakpoint at elevation = 0 and apply discontinuous use of color gradients. Creates a nice water effect when set to true, but may be visually deceptive for land topography that is below sea level. Defaults to true. |
| fallback | stringhex color value |
Fallback color to use if calculated topo values escape the color mapping algorithm. |
Colors and Breakpoints Hints and Tips
There are countless combinations of colors, breakpoints, continuous, and breakAt0. Many uses cases are untested, so open an issue or PR if you run into problems. Here are a few tips to get nice results:
topotype
|
Hints / Requirements |
elevation
|
If using breaksAt0: true, colors and breakpoints must be of the same length, unless your breakpoints already includes 0. If it already includes 0, breakpoints must contain one value more than colors. See the demo for examples.
|
slope
|
Slope layers are fairly simple, but see the limitations section. |
aspect
|
colors and breakpoints should be of the same length. colors must be circular, meaning its first value is the same as its last. breakpoints must start and end with 0 and 360:
|
slopeapsect
|
All the same rules apply as from topotype: aspect. I would recommend not using continuous: true on a slopeaspect layer, as it is very CPU heavy and slow. This needs optimization. I would recommend considering another visualization for that specific effect. Read more here.
|
configure
You may find it useful to preconfigure leaflet-topography ahead of time. You can use the configure function to do so, which will eliminate the need to pass an options argument to getTopography, or to pass your token to the TopoLayer constructor.
// Create a map
const map = L.map('mapDiv', mapOptions));

// Configure leaflet-topography
L.Topography.configure({
  token: your_mapbox_token
});

// Use leaflet topography, no need to pass options
map.on(click, async e => {
  const { elevation, slope, aspect } = await L.Topography.getTopography(e.latlng)
  console.log(elevation, slope, aspect)
})

// Add a TopoLayer, no need to pass token
const elevationLayer = new TopoLayer({ topotype: 'elevation' })
preload
preload is a convenience function which takes in an aray of L.LatLngBounds and saves all DEM tiles within those bounds to the cache. If you know you will be doing analysis in a certain area(s), preload will perform all the data fetching ahead of time. You must call configure with your token or tilesUrl before calling preload:
import L from 'leaflet';
import { preload, configure } from 'leaflet-topography';

const map = L.map('mapdiv', mapOptions));

configure({
  token: 'your_mapbox_access_token',
  priority: 'storage'
});

const corner1 = L.latLng(40.712, -74.227);
const corner2 = L.latLng(40.774, -74.125);
const analysisArea1 = L.latLngBounds(corner1, corner2);

const corner3 = L.latLng(41.712, -72.227);
const corner4 = L.latLng(41.774, -72.125);
const analysisArea2 = L.latLngBounds(corner3, corner4);

preload([analysisArea1, analysisArea2]);

map.on('click', e => {
  getTopography(e.latlng)
    .then(results => console.log(results));
});
Be careful! Calling preload on too large an area with a high scale may cause your browser to try to fetch hundreds or even millions of tile images at once!
Limitations
TopoLayertopotype: slopedoes not consider distance betwen pixels when calculating and coloring slope. Lower zoom levels produce higher slope values, meaning the layer tends to "white out" as you zoom out, and "black out" as you zoom in. Interestingly, this is in contrast to usingrasterFunction: "Slope_Degrees"on an esri-leaflet terrain layer, which blacks out as you zoom out.topotype: slopeaspectwith acontinuous: trueis very slow, as each pixel's color must be calculated across two gradients - one to interpolate between aspect colors, and another to interpolate between the resultant aspect color and the slope value. This goes against the philosophy of this plugin, and should probably not be used.Bug: When creating a
TopoLayer, you can pass a customheightFunctionon a per-layer basis inside thecustomizationobject. However, currently there is a bug that is not allowing the stringified function to be passed to the web workers when passed as acustomizationoption. For this reason, I recommend defining yourheightFunctionin theconfigurefunction:L.Topography.configure({ heightFunction: (R, G, B) => return some_function_of_R_G_B })If you want to define the
heightFunctionfor a specific TopoLayer only, you can pass it as a property ofcustomization, but if must be stringified:const customTopo = new TopoLayer({ topotype: 'aspect', tilesUrl: "your_url_here", customization: { heightFunction ((R, G, B) => { return return some_function_of_R_G_B; }).toString() } })
Planned Improvements
- Fix aforementioned
TopoLayerbug - Units option for
getTopography? - Fade-in effect on
TopoLayertiles when imageData is posted - Incorporate zoom level into
TopoLayer({ topotype: slope })for consistent visuals across zoom levels - Smoothen
TopoLayerat higher levels - General colorization algorithm optimization
Alternatives
Esri-leaflet can be used for both querying and visualizing topographic data in leaflet with relative ease. You can see some examples of how to do this in my articles Slope and Aspect as a function of LatLng and Visualizing Topography. Leaflet-topography grew out of my dissatisfaction esri-leaflet, as I was in need of a way to query hundrends of points in the same area for topographic data in a very short time (on the order of seconds).
There are many tile layers and image layers which visualize slope, aspect, hillshade, and elevation, and you are likely to find a pre-fab layer that suits your needs. I wanted to have full control over customizing the coloration of my layers, which is what inspired TopoLayer.
Further Reading
If you are interesting in nerding out on this as hard as me, here are some interesting articles about topography and hillshading, also in a mapbox context:
- Hillshade, by Sahil Chinoy
- DIY Hillshade, by Andy Woodruff
- Mapbox hillshade and satellite map blending, by Armand Emamdjomeh
License
GPL-3.0 License