README
Pol.js
Embed the most up to date political polling data and charts in your site with pol.js.

Live Demo with React.js
About:
Pol.js is a synthetic API that retrieves up to the minute polling data from Real Clear Politics and embeds it in your website hassle-free.
As Real Clear Politics does not provide a formal API, but makes their data public, Pol.js fills that gap by providing a synthetic API that mimics the functionality of a public API.
A Pol.js call to Pol.presidentialPoll(state) makes an AJAX request to the URL where the RCP polling data for that state 'lives'.
RCP polling data URLs are constructed in the following manner: http://www.realclearpolitics.com/epolls/json/XXXX_historical.js where the Xs represent the unique four digit number assigned to the poll. These values are hard coded into Pol.js for lookup by state or number.
As RCP's data is wrapped in a callback, Pol.js utilizes a JSONP callback to extract the data.
$.ajax(
  {
    url: rcpURL + pollID.toString() + historical,
    dataType: 'jsonp',
    jsonpCallback: 'return_json',
    success: (someData) => {
      callBack(someData);
    },
    error: () => {
      //try again if there's a problem
      _make_request(pollID, callBack);
    }
  });
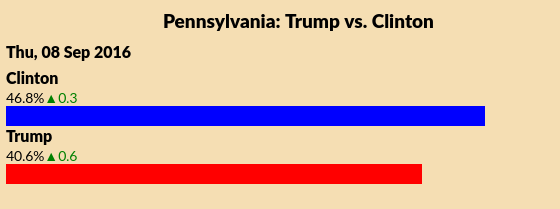
Pol.js can render the most recent data as a bar graph.
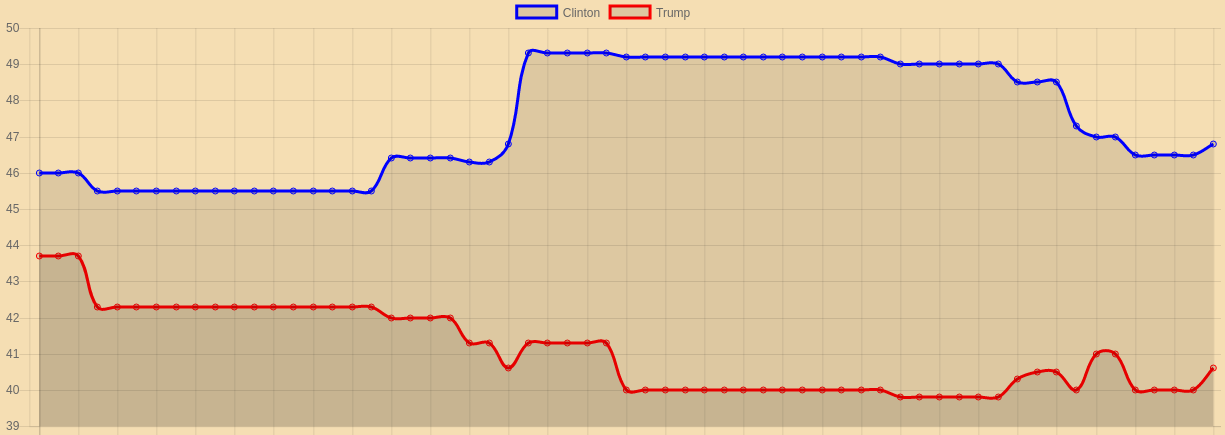
Or as a historical canvas line chart
Quick Start:
Ensure that you include jquery somewhere. In your html body, include:
<div class="polls" id="polls-root">

</div>
Embedding Charts
Pol.js uses Chart.js to draw charts. It is included as a dependency in the npm package.
In your html file, create a canvas element with id 'canvas':
<canvas id="canvas" width="600" height="300"></canvas>
call pollChart with your desired data passed in as a string:
Pol.pollChart('four-way-national');
If you want to constrain the size of your chart, place it in a div with a fixed size:
<div class="canvas-container" style: 'width: 600px; height: 300px;'>
  <canvas id="canvas" width="600" height="300"></canvas>
</div>
It's that easy!
Documentation:
Pol.presidentialPoll(state = 'national', format = 'html')
Displays presidential polling as html or json for the specified state. If no state is specified, displays national polling data. If no format is specified, renders HTML to
<div id "polls-root">
Note that you can specifiy a specific RCP poll ID by passing in a poll ID number as the state parameter, so
Pol.presidentialPoll(5542);
//is the same as:
presidentialPoll('virginia', 'html');
You can get the 4 way race polling with:
Pol.presidentialPoll('four-way-national');
Senate Races
2016 senate races are also available with Pol.js.
Pol.senatePoll('Ohio')
Pol.senateChart('Ohio')
Coming Soon
React Component