README
react-native-f2charts
![]()
F2 charts for react-native
Installation
yarn add react-native-f2charts or npm i react-native-f2chartsCopy
node_moules/react-native-f2charts/src/f2chart.htmltoandroid/app/src/main/assets/f2chart.html
Example
Simple demo example
Usage
import Chart from "react-native-f2charts";
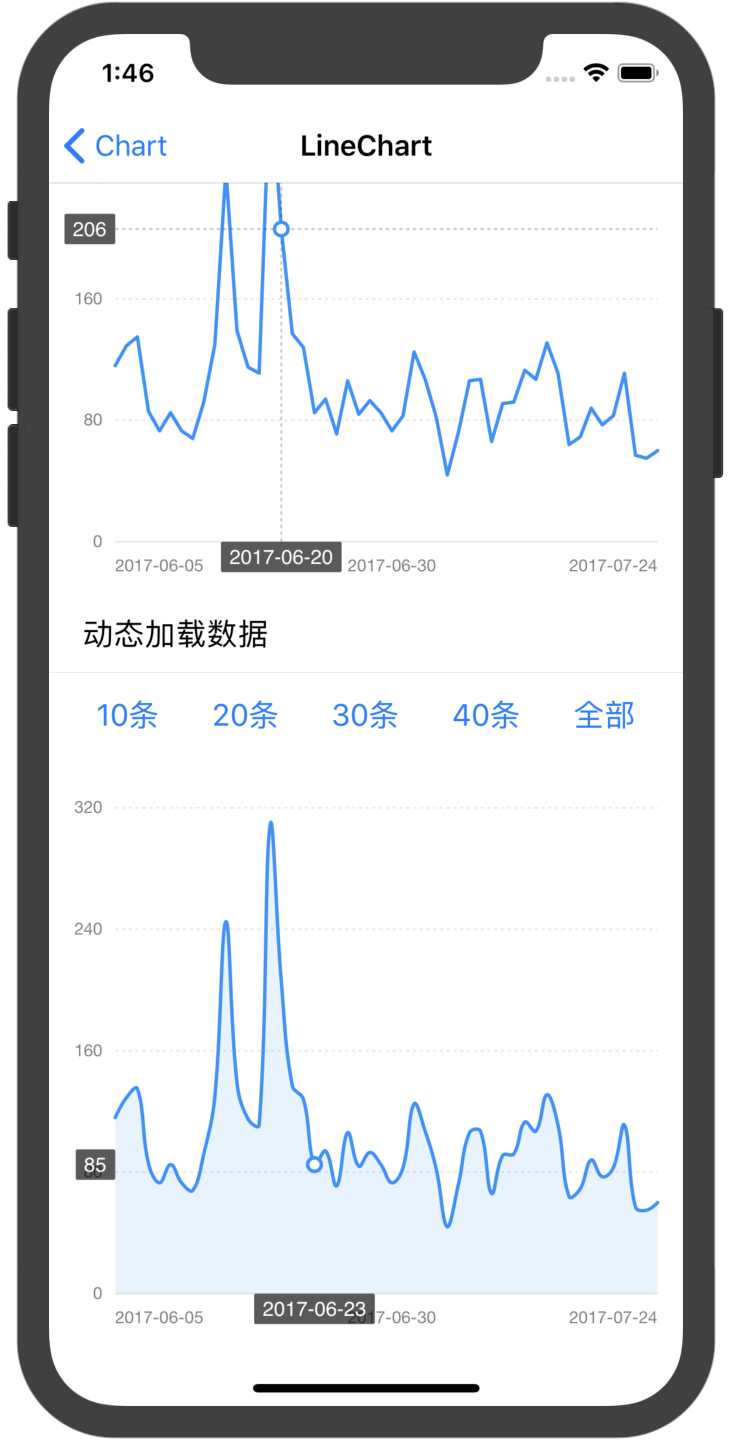
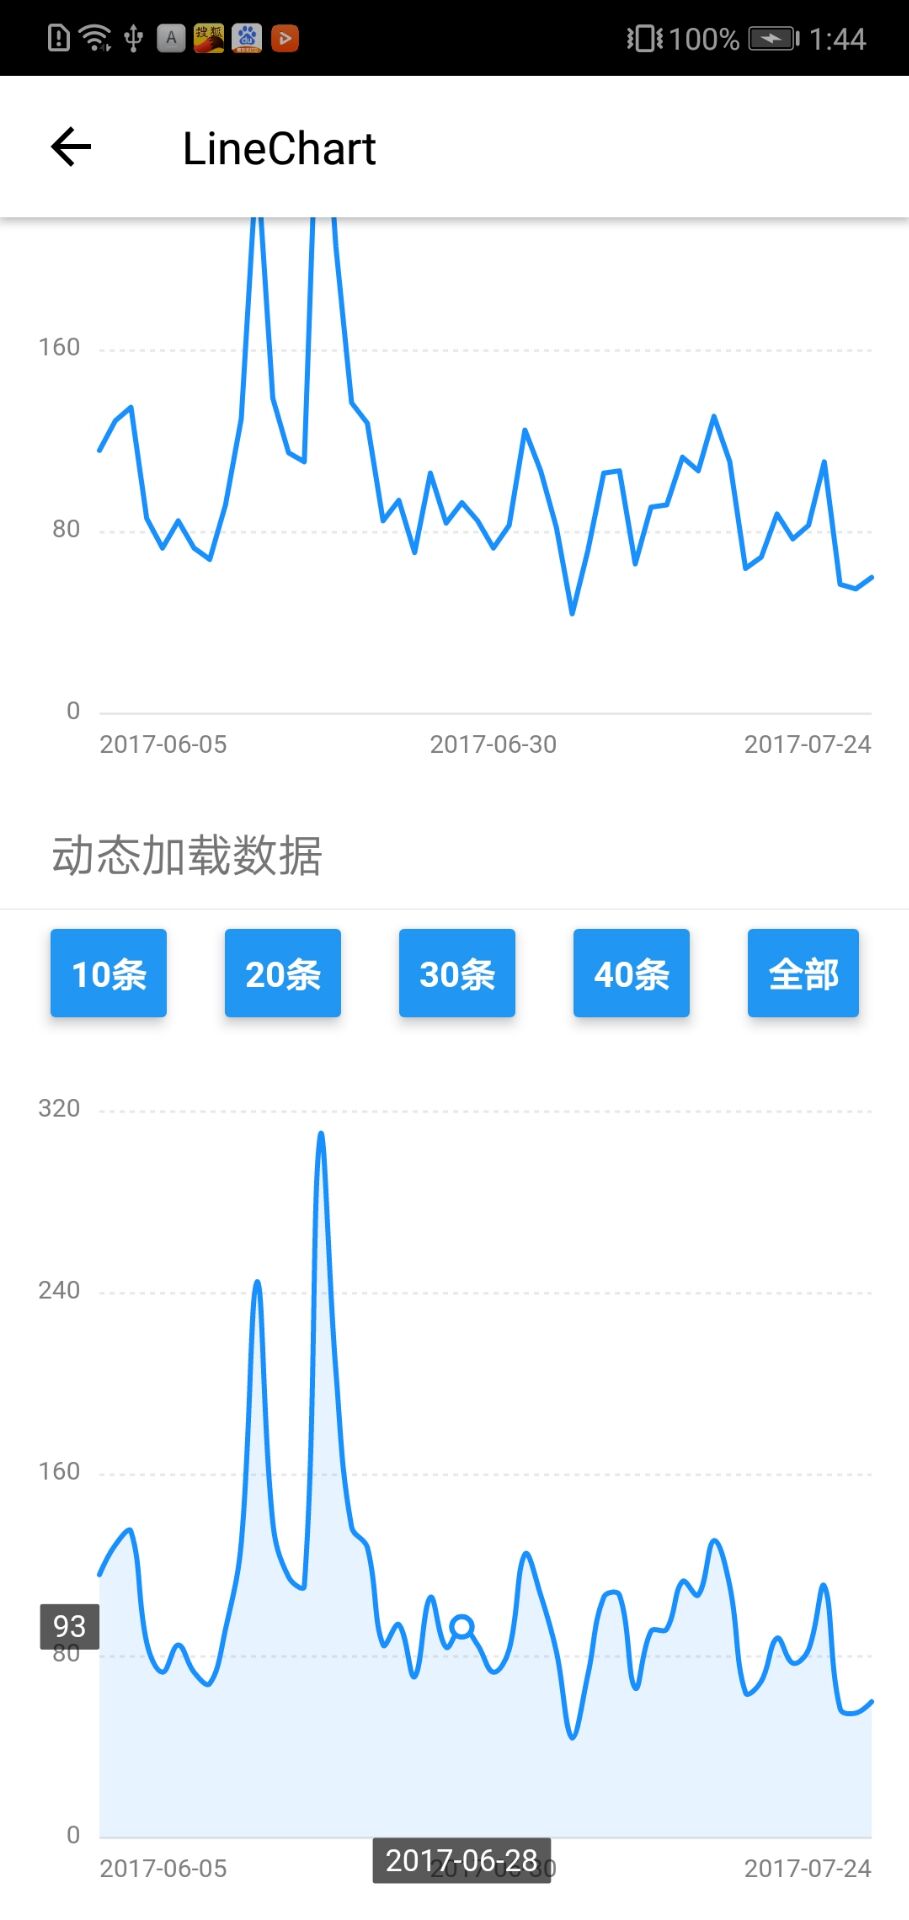
// Example from https://antv.alipay.com/zh-cn/f2/3.x/demo/line/basic.html
const initScript = data =>`
(function(){
chart = new F2.Chart({
id: 'chart',
pixelRatio: window.devicePixelRatio,
});
chart.source(${JSON.stringify(data)}, {
value: {
tickCount: 5,
min: 0
},
date: {
type: 'timeCat',
range: [0, 1],
tickCount: 3
}
});
chart.tooltip({
custom: true,
showXTip: true,
showYTip: true,
snap: true,
onChange: function(obj) {
window.postMessage(stringify(obj))
},
crosshairsType: 'xy',
crosshairsStyle: {
lineDash: [2]
}
});
chart.axis('date', {
label: function label(text, index, total) {
var textCfg = {};
if (index === 0) {
textCfg.textAlign = 'left';
} else if (index === total - 1) {
textCfg.textAlign = 'right';
}
return textCfg;
}
});
chart.line().position('date*value');
chart.render();
})();
`;
...
render() {
return (
<View style={{ height: 350 }}>
<Chart initScript={initScript(data)} />
</View>
)
}
...
`
Props
| Prop | type | Description | Required |
|---|---|---|---|
initScript |
string | Initializes the F2 Chart | yes |
data |
Array | Chart data to be drawn | no |
onChange |
Function | Tooltip onchange | no |
webView |
ReactElement | Use a custom WebView component (optional). By default, react-native-webview is used. |
no |
Notice
- Canvas
idischartinstead of `mountNode' as described in the official documentation - The tooltip's
onChangehandler is also defined in HTML.JSON.stringifycan be used to inspect any errors - If using
react-native-webview,thepostMessagetooltip is given bywindow.ReactNativeWebView.postMessage