README
sg-heatmap
Open-source all-in-one Swiss Army knife tool for creating Choropleth maps
Motivation
How do you generate a Choropleth map?
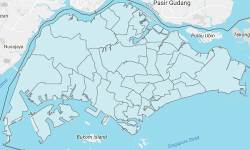
Step 1:
First get a bunch of polygons
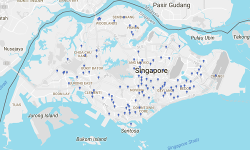
Step 2:
Then get a ton of location data points
Step 3:
Assign each data point to an area (i.e. binning)
Step 4:
Aggregate the data points in each bin (area) with an aggregating function (eg. count, mean, median)
Step 5:
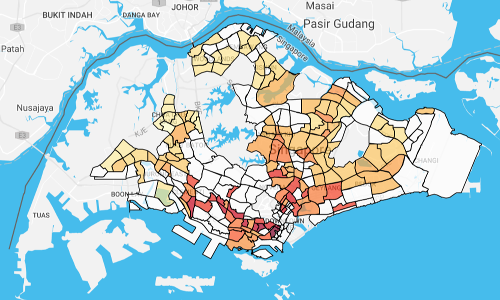
Map each bin's aggregated value to a color using a color scale
Step 6:
Render the colored polygons onto Google map
Step 7:
Received a new set of data points? Repeat Step 3 to Step 6
Clearly generating a Choropleth is not an easy task. Our goal is to provide a simple yet highly customizable JavaScript tool for data enthusiast to spend less time engineering and more time building beautiful visualizations.
Content
- A basic example
- Binning by key / Working with pre-aggregated data
- NEW Plugin to support LeafletJS
- NEW Plugin to support MapboxGL
- NEW Plugin to support OpenLayers
- API Documentation
- Installing
- Importing to project
- Using predefined maps with polygon data loaded
- Defining map with your own polygon data
- Polygon data must takes the format of an array of GeoJSON feature objects
- Defining the aggregating function
- List of predefined aggregating functions
- .update( ) method
- .getStat( ) method
- .render( ) method
- colorScale function
- Using predefined colorScale
- List of predefined colorScale
- Using colorScale helper function to generate customized colorScale
- Normalization and remapping of values
- Advance Topics
A basic example
import SgHeatmap from 'sg-heatmap/dist/predefined/URA_subzone'
import {register_MEAN} from 'sg-heatmap/dist/helpers'
import {Spectral} from 'sg-heatmap/dist/helpers/color'

import dataPoints from './dataPoints.json'

// initialize heatmap
var heatmap = new SgHeatmap( )

// set up heatmap to use MEAN for aggregating
register_MEAN(heatmap)

// pass in the data points
// binning and aggregating is done in one step
dataPoints.forEach(pt => {
  heatmap.update([pt.lng, pt.lat], pt.wt)
})

// initialize color scale
var colorScale = Spectral()

// initialize renderer
var renderer = heatmap.initializeRenderer(colorScale, {
  strokeWeight: 1,
  strokeColor: 'black',
  strokeOpacity: 1,
  fillColor: 'white',
  fillOpacity: 0.7
})
renderer.setMap(googleMap)

// render
heatmap.render('mean')
Binning by key / Working with pre-aggregated data
Sometimes we might be working with pre-aggregated data. Instead of binning and updating with the location (lnglat), you want to bin directly to each polygon using keys. In this case we provides a helper function to modify your SgHeatmap object
import {insideByKey} from 'sg-heatmap/dist/helpers'
import aggregatedData from './aggregatedData.json'

insideByKey(heatmap)
aggregatedData.forEach(pt => {
  heatmap.update(pt.keys, pt.wt)
})
One potential use case is doing the (relatively time-consuming) binning and aggregating server-side and send only the aggregated values to the client for rendering
// Server-side
import SgHeatmap from 'sg-heatmap/dist/predefined/URA_subzone'
import {register_MEAN} from 'sg-heatmap/dist/helpers'
import dataPoints from './dataPoints'

var heatmap = new SgHeatmap()
register_MEAN(heatmap)

dataPoints.forEach(pt => {
  heatmap.update([pt.lng, pt.lat], pt.wt)
})

var stat = heatmap.getStat('mean')
// Send 'stat' object to client
// Client-side
import SgHeatmap from 'sg-heatmap/dist/predefined/URA_subzone'
import {register_LATEST} from 'sg-heatmap/dist/helpers'

var heatmap = new SgHeatmap()
register_LATEST(heatmap)

// Receive 'stat' object from server
Object.keys(stat.values).forEach(key => {
  heatmap.update([key], stat.values[key])
})

// initialize colorScale
// initialize renderer...

// call render on stat 'latest'
heatmap.render('latest')
NEW Plugin to support LeafletJS
import SgHeatmap from 'sg-heatmap/dist/predefined/URA_subzone'
import supportLeaflet from 'sg-heatmap/dist/plugins/leaflet'
import {register_MEAN} from 'sg-heatmap/dist/helpers'
import {Spectral} from 'sg-heatmap/dist/helpers/color'

import dataPoints from './dataPoints.json'

var heatmap = new SgHeatmap( )
supportLeaflet(heatmap)
register_MEAN(heatmap)

dataPoints.forEach(pt => {
  heatmap.update([pt.lng, pt.lat], pt.wt)
})

var colorScale = Spectral()

// .initializeRenderer( ) has been overridden to
// return a Leaflet GeoJSON layer
// refer to http://leafletjs.com/reference-1.0.0.html#geojson
var renderer = heatmap.initializeRenderer(colorScale, {
  weight: 1,
  color: 'black',
  opacity: 1,
  fillColor: 'white',
  fillOpacity: 0.7
})
renderer
  .bindTooltip(layer => layer.feature.properties.Subzone_Name)
  .addTo(leafletMap)

heatmap.render('mean')
NEW Plugin to support MapboxGL
import SgHeatmap from 'sg-heatmap/dist/predefined/URA_subzone'
import supportMapboxGL from 'sg-heatmap/dist/plugins/mapboxgl'
import {register_MEAN} from 'sg-heatmap/dist/helpers'
import {Spectral} from 'sg-heatmap/dist/helpers/color'

import dataPoints from './dataPoints.json'

var heatmap = new SgHeatmap( )
supportMapboxGL(heatmap)
register_MEAN(heatmap)

dataPoints.forEach(pt => {
  heatmap.update([pt.lng, pt.lat], pt.wt)
})

mapboxglMap.on('load', e => {
  var colorScale = Spectral()

  // .initializeRenderer( ) requires map to be passed in as the first argument
  // returns an object with the following properties
  // layer: layer id of the choropleth layer
  // source: geojson data source backing the choropleth layer
  // remove: method to clear the choropleth layer
  var renderer = heatmap.initializeRenderer(mapboxglMap, colorScale, {
    'line-width': 1,
    'line-color': 'black',
    'line-opacity': 1,
    'fill-color': 'white',
    'fill-opacity': 0.7
  })

  var tooltip = new mapboxgl.Popup({
    closeButton: false,
    closeOnClick: false
  })

  mapboxglMap.on('mousemove', renderer.layer, e => {
    tooltip
      .setLngLat(e.lngLat)
      .setText(e.features[0].properties.Subzone_Name)
      .addTo(mapboxgMap)
  })

  mapboxgMap.on('mouseleave', renderer.layer, e => {
    tooltip.remove()
  })

  heatmap.render('mean')
})
NEW Plugin to support OpenLayers
import SgHeatmap from 'sg-heatmap/dist/predefined/URA_subzone'
import supportOpenLayers from 'sg-heatmap/dist/plugins/openlayers'
import {register_MEAN} from 'sg-heatmap/dist/helpers'
import {Spectral} from 'sg-heatmap/dist/helpers/color'

import dataPoints from './dataPoints.json'

var heatmap = new SgHeatmap( )
supportOpenLayers(heatmap)
register_MEAN(heatmap)

dataPoints.forEach(pt => {
  heatmap.update([pt.lng, pt.lat], pt.wt)
})

var colorScale = Spectral()

// defaultStyle and addonStyle need to be OpenLayers ol.style.Style object
var defaultStyle = new ol.style.Style({
  stroke: new ol.style.Stroke({
    color: 'black',
    width: 1
  }),
  fill: new ol.style.Fill({
    color: 'white'
  })
})

// .initializeRenderer( ) has been overridden to
// return an OpenLayers ol.layer.Vector object
// refer to http://openlayers.org/en/latest/apidoc/ol.layer.Vector.html
var renderer = heatmap.initializeRenderer(colorScale, defaultStyle)
renderer.setOpacity(0.7)
openLayersMap.addLayer(renderer)

heatmap.render('mean')
API Documentation
Installing
npm install --save sg-heatmap
Importing to project
import SgHeatmap from 'sg-heatmap'
// OR in ES5
var SgHeatmap = require('sg-heatmap')
Using predefined maps with polygon data loaded
import SgHeatmap from 'sg-heatmap/dist/predefined/URA_region'
// OR
import SgHeatmap from 'sg-heatmap/dist/predefined/URA_planning_area'
// OR
import SgHeatmap from 'sg-heatmap/dist/predefined/URA_subzone'
// OR
import SgHeatmap from 'sg-heatmap/dist/predefined/SPF_npc'

// initialize
var heatmap = new SgHeatmap()
Impt: If using predefined maps browser-side, include json-loader in your webpack config
Data source:
- https://data.gov.sg/dataset/master-plan-2014-region-boundary-web
- https://data.gov.sg/dataset/master-plan-2014-planning-area-boundary-web
- https://data.gov.sg/dataset/master-plan-2014-subzone-boundary-web
- https://data.gov.sg/dataset/singapore-police-force-npc-boundary
Defining map with your own polygon data
import polygonData from './polygonData.json'

var heatmap = new SgHeatmap(polygonData.features)
Polygon data must takes the format of an array of GeoJSON feature objects
Position: [Number, Number]
// first element longitude
// second element latitude

LinearRing: Array<Position>
// first position to match last position

Polygon: {
  type: 'Polygon',
  coordinates: Array<LinearRing>, // required
  // first element is outer boundary
  // second element onward are inner "holes"
  bbox: [Number, Number, Number, Number] // optional
  // first element West bound, second element South bound
  // third element East bound, fourth element North bound
}

MultiPolygon: {
  type: 'MultiPolygon',
  coordinates: Array<Array<LinearRing>>,
  bbox: [Number, Number, Number, Number]
}

Feature: {
  type: 'Feature'
  id: String, // required, must be unique
  properties: Object, // optional, meta data in key/value form
  geometry: Polygon | MultiPolygon // required
}

polygonData: Array<Feature>
Refer to relevant sections in IETF's 2015 GeoJSON Specification (RFC7946)
- https://tools.ietf.org/html/rfc7946#section-3.2
- https://tools.ietf.org/html/rfc7946#section-3.1.6
- https://tools.ietf.org/html/rfc7946#section-3.1.7
- https://tools.ietf.org/html/rfc7946#section-3.1.1
- https://tools.ietf.org/html/rfc7946#section-5
Defining the aggregating function
import {register_MEAN} from 'sg-heatmap/dist/helpers'

// this step is required before passing in any data
register_MEAN(heatmap)
List of predefined aggregating functions
- register_HISTORY
- register_LATEST
- register_COUNT
- register_SUM
- register_MEAN
- register_VARIANCE
- register_STDEV
- register_MIN
- register_MAX
- register_MEDIAN
register_HISTORY and register_LATEST does not do any actual aggregating
register_HISTORY simply push data point to an array in the update order while
register_LATEST replaces old value with each update and keeps only the latest data point
.update( ) method
import dataPoints from './dataPoints.json'

// push one data point
var pt = dataPoints[0]
heatmap.update([pt.lng, pt.lat], pt.wt)

// push another data point
pt = dataPoints[1]
heatmap.update([pt.lng, pt.lat], pt.wt)

// push the remaining data points
dataPoints.slice(2).forEach(pt => {
  heatmap.update([pt.lng, pt.lat], pt.wt)
})
This design supports streaming data. Each time .update( ) is called, binning and aggregating is performed on the single data point. Therefore .getStat( ) and .render( ) can be called even without all data points loaded
// eg.
heatmap.resetState()

dataPoints.slice(0, 100).forEach(pt => {
  heatmap.update([pt.lng, pt.lat], pt.wt)
})
heatmap.getStat('mean')
// returns aggregated values for first 100 data points

dataPoints.slice(100, 200).forEach(pt => {
  heatmap.update([pt.lng, pt.lat], pt.wt)
})
heatmap.getStat('mean')
// returns aggregated values for first 200 data points

dataPoints.slice(200, 300).forEach(pt => {
  heatmap.update([pt.lng, pt.lat], pt.wt)
})
heatmap.getStat('mean')
// returns aggregated values for first 300 data points


// say you only want to check which bin data point falls into
// i.e. bin but don't update
pt = dataPoints[0]
heatmap.bin([pt.lng, pt.lat])
// this returns filtered list of heatmap.children
// where inside function evaluates true

// to get their respective key
var matchingKeys = heatmap.bin([pt.lng, pt.lat])
  .map(child => child.key)
.getStat( ) method
// returns
var stat = getStat('mean') = {
  stat: String, // name of statistic queried (in this case 'mean')
  values: Object, // key/value map of aggregated stat for each child that has been matched to at least one data point
  unchanged: [String], // keys of children where no update (i.e. not matched to any data point)
  min: Number, // minimum among the set of values in stat.values
  max: Number // maximum among the set of values in stat.values
}
Each data point only needs to be passed in once and any number of statistics can be called on the SgHeatmap Object
// eg.
import {
  register_MEAN, register_MAX, register_MIN
} from 'sg-heatmap/dist/helpers'

register_MEAN(heatmap)
register_MAX(heatmap)
register_MIN(heatmap)

dataPoints.forEach(pt => {
  heatmap.update([pt.lng, pt.lat], pt.weight)
})

heatmap.getStat('mean') // return MEAN
heatmap.getStat('max') // return MAX
heatmap.getStat('min') // return MIN
.render( ) method
// initialize renderer
heatmap.initializeRenderer(colorScale, defaultStyle, addonStyle)

// initialize colorScale by providing domain min/max endpoints
heatmap.render(key, domain) // key is the name of the statistic to render
- .initializeRenderer( ) method requires a colorScale function to be passed in as its first parameter (see below)
- defaultStyle and addonStyle are optional style options to be applied onto map polygons
- refer to https://developers.google.com/maps/documentation/javascript/3.exp/reference#Data.StyleOptions
- defaultStyle applies to every polygon (including those in the unchanged group)
- addonStyle applies to those polygons that has been assigned at least one data point
- do not set 'fillColor' in addonStyle as it will be overridden by the fillColor colorScale specify
colorScale function
Any function that maps numeric values between 0 and 1 to CSS colors
// example
colorScale(0.5) // returns 'orange'
colorScale(1) // returns '#ff0000'
Using predefined colorScale
import {Spectral} from 'sg-heatmap/dist/helpers/color'

var colorScale = Spectral()
List of predefined colorScale
- eg. Spectral, YlOrRd, Purples
- Refer to COLORBREWER 2.0 for the full set of color schemes available
Using colorScale helper function to generate customized colorScale
import generateColorScale from 'sg-heatmap/dist/helpers/color'

var colorArray = ['white', 'yellow', 'orange', 'red', 'black']

var colorScaleOptions = {
  transform: 1,
  bezierInterpolate: false,
  correctLightness: true,
  interpolationMode: 'lab'
}

var customColorScale = getColorScale(colorArray, colorScaleOptions)
Refer to chroma.js docs for detail explanation of the different colorScaleOptions
Normalization and remapping of values
Since colorScale accepts input value only between 0 and 1 while stat.values can be any numeric value. Values in stat.values are first normalized before passing into colorScale. By default, we perform a linear interpolation with domain end points set to the min and max values
function normalize (value) {
  return (value - stat.min) / (stat.max - stat.min)
}
You may set your own domain by providing it through an option argument in render( ). Eg.
heatmap.render('mean', {domain: [100, 1000]})
Sometimes linear mapping of value to color may not visibly separate the different values sufficiently (eg. majority of values are clustered in the lower range) In this case, we may want to apply a power transformation to accentuate difference within certain part of the domain.
The power transformation to apply can be specified in the same option argument. Eg.
// to accentuate difference in the lower range, set transformation < 1
heatmap.render('mean', {transform: 0.5})

// to accentuate difference in the upper range, set transformation > 1
heatmap.render('mean', {transform: 2})
Advance Topics
Adding Event Handlers
// eg.
var defaultStyle = {
  strokeOpacity: 0,
  fillOpacity: 0
}
var addonStyle = {
  strokeOpacity: 1,
  fillOpacity: 0.7
}
// by setting opacity 0, empty areas will be hidden

var renderer = heatmap.initializeRenderer(defaultStyle, addonStyle)
renderer.addListener('click', event => {
  var Address = event.feature.getProperty('Address')
  var Subzone_Name = event.feature.getProperty('Subzone_Name')
  console.log(Subzone_Name, Address)
})
Refer to https://developers.google.com/maps/documentation/javascript/3.exp/reference#Data.Feature for details on the methods available on the feature object
// you can even do this
// creates a highlight effect on hover
renderer.addListener('mouseover', event => {
  renderer.overrideStyle(event.feature, {fillOpacity: 0.5})
})
renderer.addListener('mouseout', event => {
  renderer.revertStyle(event.feature)
})
Refer to https://developers.google.com/maps/documentation/javascript/3.exp/reference#Data for a detailed list of methods on the renderer object
// Leaflet plugin example
var renderer = heatmap.initializeRenderer(defaultStyle, addonStyle)
renderer.on({
  click: event => {
    var Address = event.layer.feature.properties.Address
    var Subzone_Name = event.layer.feature.properties.Subzone_Name
    console.log(Subzone_Name, Address)
  },
  mouseover: event => {
    event.layer.setStyle({fillOpacity: 0.5})
  },
  mouseout: event => {
    renderer.resetStyle(event.layer)
  }
})
// OpenLayers plugin example
var renderer = heatmap.initializeRenderer(defaultStyle, addonStyle)
var clickHandler = new ol.interaction.Select()
openLayersMap.on('click', event => {
  openLayersMap.forEachFeatureAtPixel(event.pixel, feature => {
    var Address = feature.get('Address')
    var Subzone_Name = feature.get('Subzone_Name')
    console.log(Subzone_Name, Address)
  })
})
Custom aggregate functions
When .update( ) is called binning and aggregation is performed simultaneously. How does this work? How does the SgHeatmap object aggregate before being exposed to the full dataset.
SgHeatmap does this by using a reducer approach in aggregation. Those who has worked with Redux.js will be familiar with this approach.
Each child of the SgHeatmap object (corresponding to one feature) has a state object
import SgHeatmap from 'sg-heatmap/dist/predefined/URA_subzone'

var heatmap = new SgHeatmap()

console.log(heatmap.children[0].state)
// prints empty object {}
To enable aggregation, first you need to define a default state on all the children by calling .setDefaultState( ).
heatmap.setDefaultState({_count: 0, _sum: 0})
console.log(heatmap.children[0].state)
// prints {_count: 0, _sum: 0}
Then you register some updater functions by calling .registerUpdater( ). These updaters are reducer functions that requires two parameters newValue and oldState and returns a newState by performing some some update operations.
// eg.
function countUpdater (newValue, oldState) {
  return {_count: oldState._count + 1}
}
function sumUpdater (newValue, oldState) {
  return {_sum: oldState._sum + newValue}
}
heatmap.registerUpdater(countUpdater)
heatmap.registerUpdater(sumUpdater)
heatmap.inspectUpdaters()
// prints a stringified version countUpdater and sumUpdater
The final step is to register a compute statistic function by calling .registerStat( ). stat functions takes in a child's state and output a numeric statistic value. Only stat that has been registered are available to be called by the .getStat( ) method.
// eg.
function computeMean (state) {
  return state._sum / state._count
}
heatmap.registerStat('mean', computeMean)
heatmap.inspectStats()
// prints a stringified version of computeMean
To reset a heatmap and empty all it's data you can call .resetState( ) and all the children's state will be reverted to the defaultState.
heatmap.resetState()
console.log(heatmap.children[0].state)
// prints {_count: 0, _sum: 0}
If all these looks too complicated to you, just use one of the predefined aggregate functions. It should do everything for you. The predefined aggregate functions provided are more than enough for most use cases.
import {register_MEAN} from 'sg-heatmap/dist/helpers'

register_MEAN(heatmap)
Another alternative (for those who have problems wrapping their head around to writing reducer functions) is to just use a history updater and rely solely on the stat function for aggregating.
// eg.
import {register_HISTORY} from 'sg-heatmap/dist/helpers'

register_HISTORY(heatmap)

function computeMean (state) {
  var sum = state._history.reduce((s, v) => s + v, 0)
  var count = state._history.length
  return sum / count
}

registerStat('mean', computeMean)
The reducer design has a few advantages:
- SgHeatmap object holds only the data needed for rendering the choropleth map instead of the entire dataset. If state needs to be passed around, you'll have a much smaller footprint.
- Supports streaming data. You can do interesting things like say 'moving average'
// eg. implementing moving average
heatmap.setDefaultState({_history: []})

function historyUpdater (newValue, oldState) {
  // clone history into new array
  var _history = [...state._history] // ES6 syntax
  if (_history.length === 10) {
    _history.shift( )
  }
  _history.push(newValue)
  return {_history: _history}
}

heatmap.registerUpdater(historyUpdater)

function computeMean (state) {
  var sum = state._history.reduce((s, v) => s + v, 0)
  var count = state._history.length
  return sum / count
}

heatmap.registerStat('movingAverage', computeMean)
Dynamic stat
There are times when it may not be feasible to pre-register all the stat we need upfront. For example:
import {register_MEAN} from 'sg-heatmap/dist/helpers'

register_MEDIAN(heatmap)

heatmap.getStat('median') // returns 50th percentile

// what if we need the 25th & 75th percentile also?
// maybe we can register multiple similar 'stat'
heatmap.registerStat('percentile25', compute25percentile)
heatmap.registerStat('percentile75', compute75percentile)

heatmap.getStat('percentile25')
heatmap.getStat('percentile75')
What if we are using a slider? (10th, 20th, 30th, ... , 90th percentile). Are we going to write one new stat for each percentile? In this case we need a more flexible way of defining your 'stat'. How about a stat function that accepts a payload?
To provide for such situation, we allow our .getstat( ) and .render( ) method to accept a function instead of a key string. What this mean is you can supplied a stat function directly rather than calling a pre-registered stat function.
// you can write a higher order function (i.e. a function generator) that returns a computePercentile function for any percentile value
function computePercentile (n) {
  return function (state) {
    // return Nth percentile of values in state._history
  }
}

heatmap.getStat(computePercentile(25)) // compute 25th percentile
heatmap.render(computePercentile(75), colorScale) // render choropleth map of 75th percentile
Cloning SgHeatmap object
import SgHeatmap from 'sg-heatmap/dist/predefined/URA_subzone'

var oldHeatmap = new SgHeatmap()

// Method 1 (cloning locally)
var newHeatmap = oldHeatmap.clone(true)
// setting option false will clone only polygon data
// but not state object

// Method 2 (for sending data between server and client)
var serializedData = oldHeatmap.serialize(true)
var newHeatmap = new SgHeatmap(JSON.parse(serializedData))
// as before, setting option false will clone only polygon data
Cloned SgHeatmap can retain original state of all its children but updaters and stats will still have to be re-registered
import {register_MEAN} from 'sg-heatmap/dist/helpers'

register_MEAN(oldHeatmap)

var newHeatmap = oldHeatmap.clone(true)
newHeatmap.inspectUpdaters( ) // prints []
newHeatmap.inspectStats( ) // prints {}
newHeatmap.getStat('mean') // throws Error

// complete clone by
register_MEAN(newHeatmap)