README
spectral-workbench.js


![]()
![]()
The JavaScript heart of Spectral Workbench; a Public Lab project to record, manipulate, and analyze spectrometric data.
spectral-workbench.js is currently set up to run in a browser, but some parts may work headless, in a JavaScript console. We hope to further separate the views from the library logic so that headless or Node.js usage is easier.
This library is primarily used in the Spectral Workbench application, running at http://spectralworkbench.org, which is a Ruby on Rails project that is also open source. Read about how to build and use your own spectrometer with it here: http://publiclab.org/wiki/spectrometer
See static demo here: https://publiclab.github.io/spectral-workbench.js/examples/
And static demo of capture interface: https://publiclab.github.io/spectral-workbench.js/examples/capture/
Try a demo of the newly rewritten capture interface here: https://publiclab.github.io/spectral-workbench.js/examples/new-capture/
Installation
In Node.js
To install spectral-workbench, run:
npm install spectral-workbench
The SpectralWorkbench.Image class uses the node-canvas package when run without a browser, so you'll need to install it by:
- running (on Debian):
sudo apt-get install libcairo2-dev libjpeg8-dev libpango1.0-dev libgif-dev build-essential g++See build instructions for other platforms here. - running
npm install
In a browser
To begin using spectral-workbench.js on a webpage, you'll need to include jQuery, and to use any HTML-based features (such as UI or graphing), you'll need to include its dependencies.
First, run:
npm install
then:
bower install
Your page should include:
<script src="node_modules/jquery/dist/jquery.min.js"></script>
<script src="bower_components/d3/d3.js" type="text/javascript"></script>
<script src="bower_components/nvd3/build/nv.d3.js" type="text/javascript"></script>
<script src="bower_components/bootstrap-css/js/bootstrap.min.js"></script>
<script src="bower_components/moment/moment.js"></script>
<link href="bower_components/nvd3/build/nv.d3.css" rel="stylesheet">
Then include the library itself:
<script src="dist/spectral-workbench.js" type="text/javascript"></script>
To see graphed output, you'll need a <div> with the id "graph", like so:
<div id="graph"></div>
A spectrum may be displayed in a d3-based graph with the Graph constructor:
jQuery(document).ready(function($) {
  graph = new SpectralWorkbench.Graph({
    spectrum_id: 1, // unique id <int>, typically a database primary key
    selector: '#graph' // defaults to "#graph" using jQuery selector syntax
  });
});
Usage
Running
If you're using this locally, the best way to run it locally is to use the http-server npm module. Install it with:
npm install -g http-server
then run the app with:
http-server
and it will open at the address: http://localhost:8080/
Inputting data
You can pass a nested array of [wavelength, intensity] data to the Spectrum constructor like this:
var data = [
  [0, 24],
  [1, 44],
  [2, 42],
  [3, 45],
  [4, 20]
];

var spectrum = new SpectralWorkbench.Spectrum(data);

spectrum.getJSON();

/*

// Output:

[ { average: 22.95, r: 22.95, g: 22.95, b: 22.95, pixel: 0 },
  { average: 43.35, r: 43.35, g: 43.35, b: 43.35, pixel: 1 },
  { average: 40.8,  r: 40.8,  g: 40.8,  b: 40.8,  pixel: 2 },
  { average: 43.35, r: 43.35, g: 43.35, b: 43.35, pixel: 3 },
  { average: 17.85, r: 17.85, g: 17.85, b: 17.85, pixel: 4 } ]

*/

// this is non-ideal, but will be expanded upon with a better calibrate API:
spectrum.json.data.lines = spectrum.calibrate(400, 500, 0, 4);
spectrum.load(); // calibrate does not save

spectrum.getJSON();

/*

// Output:

[ { average: 22.95, r: 22.95, g: 22.95, b: 22.95, wavelength: 400 },
  { average: 43.35, r: 43.35, g: 43.35, b: 43.35, wavelength: 425 },
  { average: 40.8,  r: 40.8,  g: 40.8,  b: 40.8,  wavelength: 450 },
  { average: 43.35, r: 43.35, g: 43.35, b: 43.35, wavelength: 475 },
  { average: 17.85, r: 17.85, g: 17.85, b: 17.85, wavelength: 500 } ]

*/
This assumes monochrome input with units [nanometers, 0-255], although if you're using a Public Lab webcam-based spectrometer, you'll be dealing with RGB data.
For a working example of an array-based spectrum see: https://publiclab.github.io/spectral-workbench.js/examples/array.html
You can also use a string of comma-separated values (a CSV), where each line is wavelength,intensity (similarly to the array format above):
// \n instead of linebreaks here:
var string = "400,24\n410,44\n420,42\n430,45\n440,20";

var spectrum = new SpectralWorkbench.Spectrum(string);
TSVs (tab-separated values) are also supported as of v0.0.10.
Most tests continue to use a legacy data format (that used by the SpectralWorkbench.org service) which we'd like to simplify, but for now, you can create a Spectrum object from JSON data in the following format, that does accept RGB pixel data:
var data = {
  "data": {
    "name": "Test spectrum",
    "lines":[ // as many data points as you like may be entered here:
      { "average":64.3333, "r":69, "g":46, "b":78, "wavelength":269.089 },
      { "average":31,      "r":33, "g":19, "b":41, "wavelength":958.521 }
    ]
  }
}

var spectrum = new SpectralWorkbench.Spectrum(data);
For a working example, see: https://publiclab.github.io/spectral-workbench.js/examples/
In Node.js
An example node script is available in the /examples/ directory, and some command line utilities are available in the /scripts/ directory, including ones to upload from JSON files to https://spectralworkbench.org and to extract JSON from images. For example, you could extract data from an image with:
scripts/image-extract.js --file spec/javascripts/fixtures/test-spectrum-9.png --format json > test.json
Then upload the JSON data with (replacing XXXX with your API key):
scripts/upload.js --file test.json --token XXXXXXXXXXXXXX
To write a script in Node.js, you could create and run a file like this:
#!/usr/bin/env node

var SpectralWorkbench = require('spectral-workbench').SpectralWorkbench;

var data = {
  "data": {
    "name": "Test spectrum",
    "lines":[ // as many data points as you like may be entered here:
      {"average":64.3333,"r":69,"g":46,"b":78,"wavelength":269.089},
      {"average":63.3333,"r":71,"g":45,"b":74,"wavelength":277.718},
      {"average":64,"r":71,"g":47,"b":74,"wavelength":291.524},
      {"average":64,"r":68,"g":49,"b":75,"wavelength":303.604}
    ]
  }
}

var spectrum = new SpectralWorkbench.Spectrum(data);

console.log(spectrum.getIntensity(282));
And run it with node yourscript.js. If you make a useful one, submit a pull request and I'll pull it in!
spectrum.upload(
  'https://spectralworkbench.org/spectrums.json',
  function callback(err, httpResponse, body) { console.log(body) },
  { token: "31343338303237303934" }
);
Note that this direct upload feature is experimental.
Manipulating spectrum data
Once you've initialized a Spectrum, you can add Operations to it using the following syntax:
var spectrum = new SpectralWorkbench.Spectrum(data);

spectrum.addAndParseTag('smooth:3');
Operations are a type of tag that are passed as strings in operation:value format, and there are a variety of operations available, including:
smoothsubtracttransformcrossSection(requires an image)- plus several more
Read more at https://publiclab.org/wiki/spectral-workbench-operations
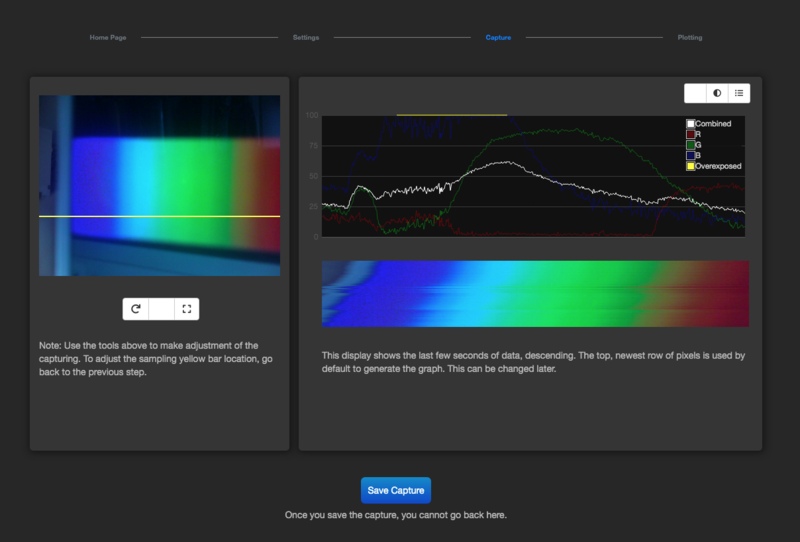
An in-progress project to port the HTML capture interface to this library can be tested at:
https://publiclab.github.io/spectral-workbench.js/examples/capture/
Follow progress at https://github.com/publiclab/spectral-workbench.js/issues/56
Contributing
We welcome community contributions to spectral-workbench.js! Learn more about contributing to Spectral Workbench or other Public Lab code projects on this page: http://publiclab.org/wiki/developers
Bug reports & troubleshooting
If you are submitting a bug, please include:
- where/when you see the issue, so we can try to reproduce it
- any relevant JavaScript console output
- your browser (and version if possible!)
- anything you can about the sequence of events which led to the bug
Thank you for your help!
Automated tests
To run Jasmine tests, open test.html in a browser. You can also run them on our Github Pages-hosted suite here: http://publiclab.github.io/spectral-workbench.js/test.
Alternatively, if you have phantomjs installed, run: grunt jasmine to run tests from the command line.
Building
spectral-workbench.js is built using a Grunt task from the source files in /src/, and the compiled file is saved to /dist/spectral-workbench.js. To build, run grunt build. To watch files for changes, and build whenever they occur, run grunt. You'll need the Grunt CLI -- npm install -g grunt-cli.
Copyright 2011-2015 Public Lab publiclab.org | spectralworkbench.org
License
spectral-workbench.js is free software: you can redistribute it and/or modify it under the terms of the GNU General Public License as published by the Free Software Foundation, either version 3 of the License, or (at your option) any later version.
Spectral Workbench is distributed in the hope that it will be useful, but WITHOUT ANY WARRANTY; without even the implied warranty of MERCHANTABILITY or FITNESS FOR A PARTICULAR PURPOSE. See the GNU General Public License for more details.
You should have received a copy of the GNU General Public License along with Spectral Workbench. If not, see http://www.gnu.org/licenses/.