README
![]()
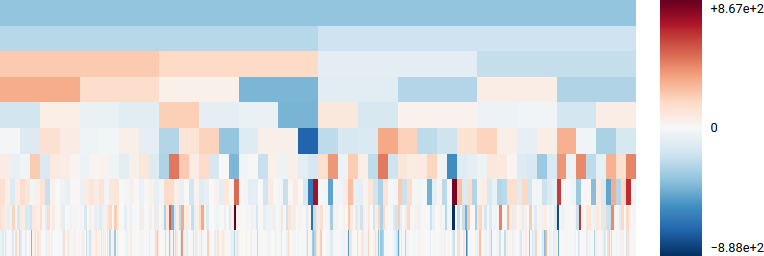
Symmetronic Scaleogram
Web component for a scaleogram visualization, e.g. for data from a discrete wavelet transform.
Using this component
Script tag
- Put a script tag similar to this
<script src='https://unpkg.com/strc-scaleogram@2.0.11/dist/strc-scaleogram.js'></script>in the head of your index.html - Then you can use the element anywhere in your template, JSX, HTML, etc.
Node Modules
- Run
npm install strc-scaleogram --save - Put a script tag similar to this
<script src='node_modules/strc-scaleogram/dist/strc-scaleogram.js'></script>in the head of your index.html - Then you can use the element anywhere in your template, JSX, HTML, etc.
In a stencil-starter app
- Run
npm install strc-scaleogram --save - Add an import to the npm packages
import strc-scaleogram; - Then you can use the element anywhere in your template, JSX, HTML, etc.
API
Attributes
data: String of an array of arrays containing the wavelet coefficients.invert-scale(optional): Set totrueif you want to invert the direction of the color scale set by thescaleattribute.scale(optional): Color scale as a string. Any valid string of a Chroma.js color scale can be used.
<strc-scaleogram
  data="[
    [3],
    [5, -5],
    [0, 2, -3, 4],
    [-8, 1, 3, -1, 0, 5, -3, -1]
  ]"
  invert-scale="true"
  scale="['#e66101', '#fdb863', '#f7f7f7', '#b2abd2', '#5e3c99']"
/>
Discrete Wavelets is a JavaScript library that already returns the coefficients in an appropriate format. But you need to convert the array to a string using JSON.stringify().
var data = JSON.stringify(
  coeffs.slice(1) // .slice(1) removes the first element, which are the approximation coefficients
);
Styling
You can adjust the style of the scaleogram.
strc-scaleogram {
  /*
   * Height of the visualization.
   */
  --strc-scaleogram-height: 16rem;

  /*
   * Color of the labels.
   */
  --strc-scaleogram-label-color: #000000;

  /*
   * Width of the scaleogram's legend.
   * The default value is 8rem.
   * This can be used to align the scaleogram with e.g. a line chart.
   * Set the right margin of a line chart to the same value as the
   * legend width and the x axes should be perfectly aligned.
   */
  --strc-scaleogram-legend-width: 8rem;
}
NPM scripts
npm install: Install dependenciesnpm start: Build in development modenpm run build: Build in production modenpm test: Run testsnpm run test:watch: Run tests in interactive watch mode