README
@logdna/browser


A code library for implementing frontend browser logging and exception capturing in LogDNA. Capture browser errors and log messages from your console and centralize them to your LogDNA instance. Optionally, use the LogDNA Browser Logger Template to get out-of-the-box Views, Boards, and Screens to analyze your browser logs.
- Module Installation
- Example Usage
- Enable CORS in LogDNA
- Browser Logger Template
- Send log lines to LogDNA
- Add custom meta data for log lines
- Session ID
- Configuration options
- Unloading websites
- Plugins (Experimental)
- Debug helpers
- Project Examples
Module Installation
Browser Logger is in Beta - API will evolve as we continue to develop and refine new features.
Using NPM:
npm install @logdna/browser
Using Yarn:
yarn add @logdna/browser
Example Usage
:warning: Before logs can be sent to LogDNA you must add your web application URL to your LogDNA account CORS configuration.
import logdna from '@logdna/browser';

// Found in Settings > Organization > API Keys
const LOGDNA_INGESTION_KEY = 'xxxxxxxxxxxxxxxxxxxxxxxxxxxxxxxx';

logdna.init(LOGDNA_INGESTION_KEY).addContext({
  // Context is appended to the metadata of each message sent to LogDNA
  // Add any custom meta data such as:
  version: 'v1.0.2',
  sessionReplay: 'http://mySessionReplayTool/',
  user: {
    email: 'user@email.email',
    userId: '987654321',
  },
});

logdna.log('Hello world!');

// By default captures console messages (see `console` options below).
console.log('Hello world!');
Enable CORS in LogDNA
:warning: Before logs can be sent to LogDNA you must add your web application URL to your LogDNA account CORS configuration.
- Login to LogDNA
- Go to Settings
- Click on Organizations
- Click on Whitelist Domains
- Add your web application's full URL, including the https and any port information
- Note: This may take around 15 minutes before the domain is properly whitelisted.
- ex:
https://www.YourAppAddressHere.com - ex:
http://localhost:3000
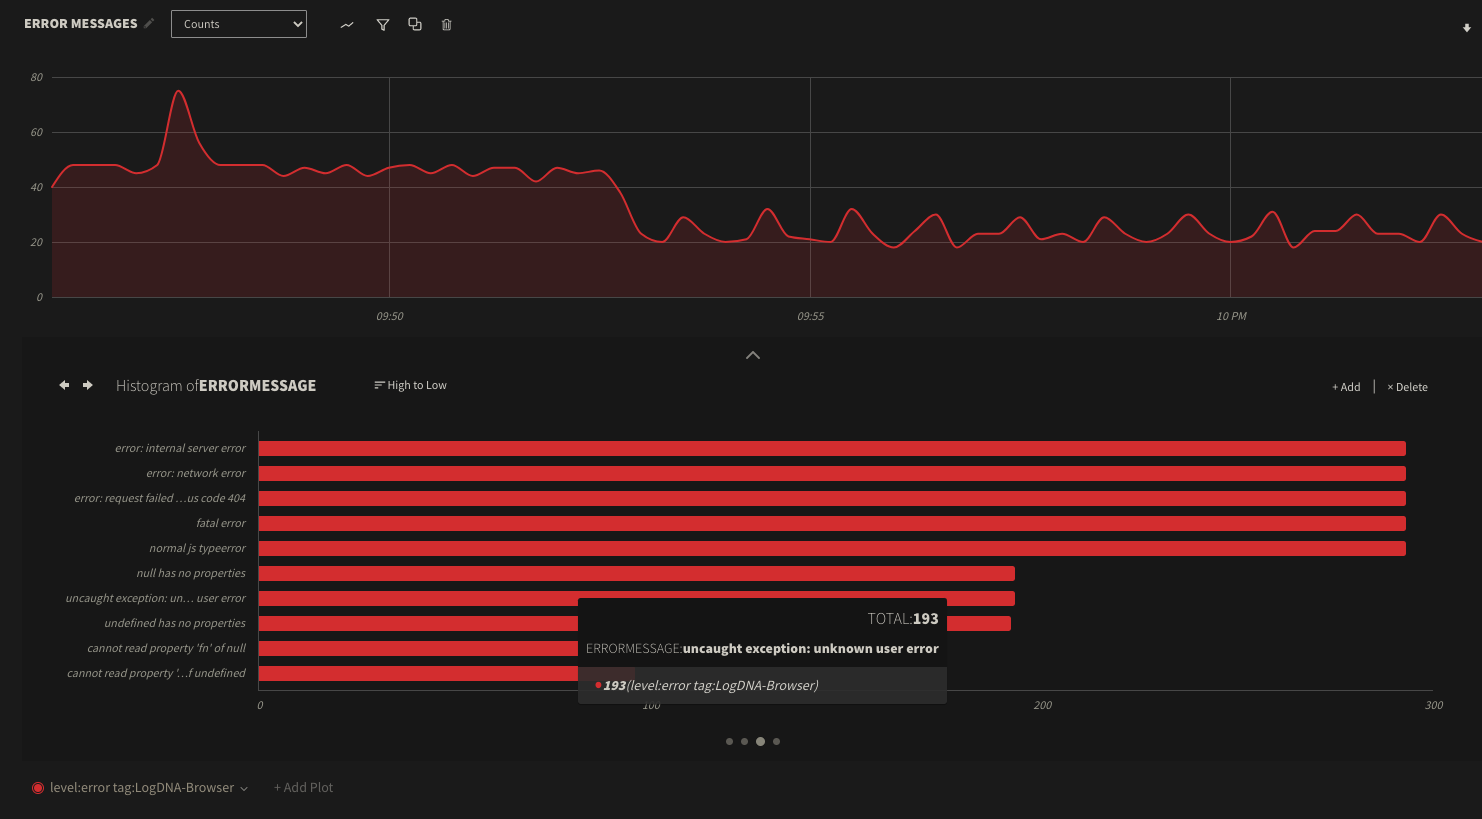
Browser Logger Template
Use the LogDNA Browser Logger Template to get out-of-the-box Views, Boards, and Screens to analyze your errors and log messages from Browser Logger.
Example Board included in the Template:
Send log lines to LogDNA
There are two ways to send log lines to LogDNA:
- Using the
console.[log, error, warn, debug, info]with the configuration optionconsole: truewill send console messages to LogDNA and also to the browser's devtools console - Using one of the following methods will just send the log message to LogDNA without sending the information to the console (unless
debugis set totruein the configuration options). The log parameter message can be of any type.
import logdna from '@logdna/browser';

logdna.log('My log message');

logdna.error('My error message');

logdna.debug('My debug message');

logdna.info('My info message');

logdna.warn('My warn message');
Each method accepts an additional lineContext parameter to add additional metadata to the meta log field in LogDNA
Example:
logdna.log('My log message', {
  thing: 'Extra Metadata',
});
Add custom metadata for log lines
Use the logdna.addContext({ }) method any time after initialization to add any custom metadata to each log line. This is useful to send application version information, logged-in user or account information, links to additional tools such as session replays, and just about anything else that you want associated with each log line.
logdna.addContext({
  // Add any custom metadata such as:
  version: 'v1.0.2',
  sessionReplay: 'http://mySessionReplayTool/',
  user: {
    email: 'user@email.email',
  },
});
LogDNA's Browser Logger will automatically add the user's browser information and the window.location object to the log line.
Example of automatically added context:
"sessionId": "d1b69ea3-41c4-4b9b-85e2-32fb94cb219c",
"browser": {
  "name": "chrome",
  "version": "87.0.4280",
  "os": "Mac OS",
  "type": "browser"
},
"location": {
  "ancestorOrigins": {},
  "href": "https://your-web-app/home?q=1234567890",
  "origin": "https://your-web-app",
  "protocol": "https:",
  "host": "your-web-app",
  "hostname": "your-web-app",
  "port": "",
  "pathname": "/home",
  "search": "?q=1234567890",
  "hash": ""
},
Session ID
When LogDNA's Browser Logger is initialized it will generate a unique uuid v4 sessionId. This sessionId will make it easy to follow a particular user/session within the LogDNA console.
Defining a Custom Session ID
You can set a custom session sessionId by calling logdna.setSessionId('your-custom-id'). Log lines sent before setting a custom session ID may contain the previous auto generated session ID.
Configuration Options
Example Configuration:
logdna.init(LOGDNA_INGESTION_KEY, {
  app: 'my-app',
  console: {
    integrations: ['error', 'warn'],
  },
  sampleRate: 5,
});
| options | default value | type | description |
|---|---|---|---|
app |
window.location.hostname |
string | Name of your application |
env |
string | An environment label attached to each message (ex. production, staging) |
|
hostname |
logdna-browser-logger | string | A hostname associated with each log line, populates the Source field in the LogDNA UI. |
tags |
'LogDNA-Browser' | string or string[] | Add custom tags used in the LogDNA log line interface. Will always contain LogDNA-Browser. |
enableStacktrace |
true |
boolean | Enable adding stack traces for each log message (does not affect error stack traces) |
console |
true |
boolean or object | Enable sending console message to LogDNA for all supported methods or an options object |
console.enable |
false |
boolean | Enable sending console message to LogDNA |
console.integrations |
['log', 'info', 'debug', 'warn', 'error'] |
array | Console methods to override for sending logs to LogDNA and to the console |
globalErrorHandlers |
true |
boolean or object | Enable adding a global error handler and unhandledPromiseRejection handler to forward to LogDNA |
globalErrorHandlers.enableErrorHandler |
false |
boolean | Enable automatic capturing and logging of unhandled errors. |
globalErrorHandlers.enableUnhandledPromiseRejection |
false |
boolean | Enable automatic capturing and logging of unhandled promised rejections. |
sampleRate |
100 | number | Percentage of sessions to track from 0 to 100. 0 for none 100 for all |
url |
https://logs.logdna.com/logs/ingest | string | LogDNA ingestion URL |
debug |
false |
boolean | When debug is true, logdna.<log, error, warn, info, debug> methods will log to both LogDNA and to the console. When false these methods will only send to LogDNA. Note: Logging console message to LogDNA is also dependant the enabled console integrations |
flushInterval |
250 | number | Number of milliseconds to buffer log lines before sending to LogDNA |
disabled |
false |
boolean | Disable the logger from sending logs |
sampleRate option
You can decrease the percentages of sessions that send logs to LogDNA by specifying the sampleRate option. The sampleRate should be a number 0 to 100 which represents the percentage of sessions that you want to send logs to LogDNA. 0 mean no sessions will send logs, 100 (the default) means every session will have logs sent. 5 for example, means that just 5 percent of the client instances initialized will send logs.
Buffer
LogDNA's Browser Logger will buffer log message going to LogDNA, the default buffer time is 250ms and is customizable via the flushInterval configuration option.
Unloading websites
The LogDNA Browser Logger will attempt to flush the logs before the page unloads. This is done via the keepalive fetch requests flag. There is a 64kb internal fetch quota limit for keep-alive requests. Any request over that will result in a network error message as per the fetch spec.
Failures
If there are failures when sending log lines to LogDNA the logger will attempt to retry sending the logs up to 30 times.
Debug helpers
The LogDNA Browser Logger exposes several helpers methods off the window.__LogDNA__ namespace.
Show the current configuration
___LogDNA__.showConfig();
Show the current context
___LogDNA__.showContext();
Turn debugging on and off.
This is helpful for when logging all of your messages via the logdna log methods in prod but would like to see then in the browser console while debugging.
___LogDNA__.setDebug(true);
Project Examples
Project examples can be found under /examples.
React Example
npm link
cd examples/react-example
npm install
npm link "@logdna/browser"
REACT_APP_LOGDNA_INGEST_KEY="<YOUR_KEY_HERE>" npm start
Visit http://localhost:3000
HTML Example
npm run build
npm run serve # Starts up static server for build on localhost:5000
cd examples/html-example
npm install
npm start
Visit http://localhost:1234
Happy Logging!