README
Canvas-OrgChart
Draw orgchart/genealogychart with canvas.
Installation
Of course, you can directly use the standalone build by including canvas-orgchart.js in your webapps.
Install with npm
$ npm install canvas-orgchart
Usage
Instantiation Statement
<canvas id="canvas"></canvas>
import CanvasOrgChart from 'canvas-orgchart'

const canvas = document.getElementById('canvas')
const canvasOrgChart = new CanvasOrgChart(options)

canvasOrgChart.render(canvas, data)
Structure of Datasource
{
  name: 'father', // necessary.
  avatar: '',
  sex: 0,
  children: [ // necessary and must be an array.
    {
      name: 'self',
      avatar: '',
      sex: 0,
      children: []
    }
  ]
}
Options
| Name | Type | Default | Description |
|---|---|---|---|
| width | number | auto | Canvas width. |
| height | number | auto | Canvas height. |
| scale | array | [1, 1] | Scales the canvas units by x horizontally and by y vertically. |
| originX | number | 0 | Draw chart x starting coordinates. |
| originY | number | 0 | Draw chart y starting coordinates. |
| padding | array | [0, 0, 0, 0] | The chart padding as css padding. |
| node | object | Style of the node. | |
| node.width | number | 60 | Node width. |
| node.height | number | 160 | Node height. |
| node.spacing | array | [20, 20] | Node spacing. |
| node.color | string | white | Node color. |
| node.background | string | cornflowerblue | Node background. |
| node.customBackgrounds | array | [] | Customize backgrounds based on property values. |
| node.defaultAvatar | string | '' | Node avatar. |
| node.customAvatar | object | null | Customize avatar based on property values. |
| node.nodeTemplate | array or function | [] | Custom node template.Global replacement if it's a function. |
Options Example
options = {
  width: 0, // auto
  height: 0,
  scale: [1, 1],
  originX: 0,
  originY: 0,
  padding: [10, 50],
  node: {
    width: 60,
    height: 160,
    spacing: [20, 20],
    color: 'white',
    background: 'cornflowerblue',
    customBackgrounds: [
      {
        attributeName: 'sex',
        checkOwn: false,
        color: {
          0: 'cornflowerblue',
          1: 'lightcoral'
        }
      },
      {
        attributeName: 'self',
        checkOwn: true,
        color: 'black'
      }
    ],
    defaultAvatar: '/images/male.jpg',
    customAvatar: {
      attributeName: 'sex',
      avatars: {
        0: '/images/male.jpg',
        1: '/images/female.jpg'
      }
    },
  },
  nodeTemplate: [
    {
      attributeName: 'spouse',
      checkOwn: true,
      width: 120,
      draw: function(that, ctx, x, y, node) {
        that.drawAvatar(ctx, x, y, node)
        that.drawAvatar(ctx, x + this.width / 2, y, node.spouse)
        // node color
        if (node.sex === 0) {
          ctx.fillStyle = 'cornflowerblue'
        } else {
          ctx.fillStyle = 'lightcoral'
        }

        ctx.fillRect(x, y + that.nodeWidth, that.nodeWidth, that.nodeHeight - that.nodeWidth)
        if (node.spouse && node.spouse.sex === 0) {
          ctx.fillStyle = 'cornflowerblue'
        } else if (node.spouse && node.spouse.sex === 1) {
          ctx.fillStyle = 'lightcoral'
        }
        ctx.fillRect(x + this.width / 2, y + that.nodeWidth, that.nodeWidth, that.nodeHeight - that.nodeWidth)
        ctx.stroke()
        const textHeight = that.nodeHeight - that.nodeWidth
        that.drawVerticalText(ctx, x, y + that.nodeWidth, that.nodeWidth, textHeight, node.name)
        that.drawVerticalText(ctx, x + this.width / 2, y + that.nodeWidth, that.nodeWidth, textHeight, node.spouse.name)
      }
    }
  ]
}
The nodeTemplate can write multiple objects inside,each object is drawn for a different property. Explain what each of its properties does:
| Name | Type | Default | Description |
|---|---|---|---|
| attributeName | string | The node that owns this property uses this custom template. | |
| checkOwn | boolean | Check whether the node owns this property. | |
| width | number | 60 | The node width. |
| draw | function | null | How to draw this node. |
Methods
render(canvas, data)
It's the useful way when users want to re-initialize or refresh orgchart based on new options or reload new data.
Property
currentSelected
Get the node that is currently selected.
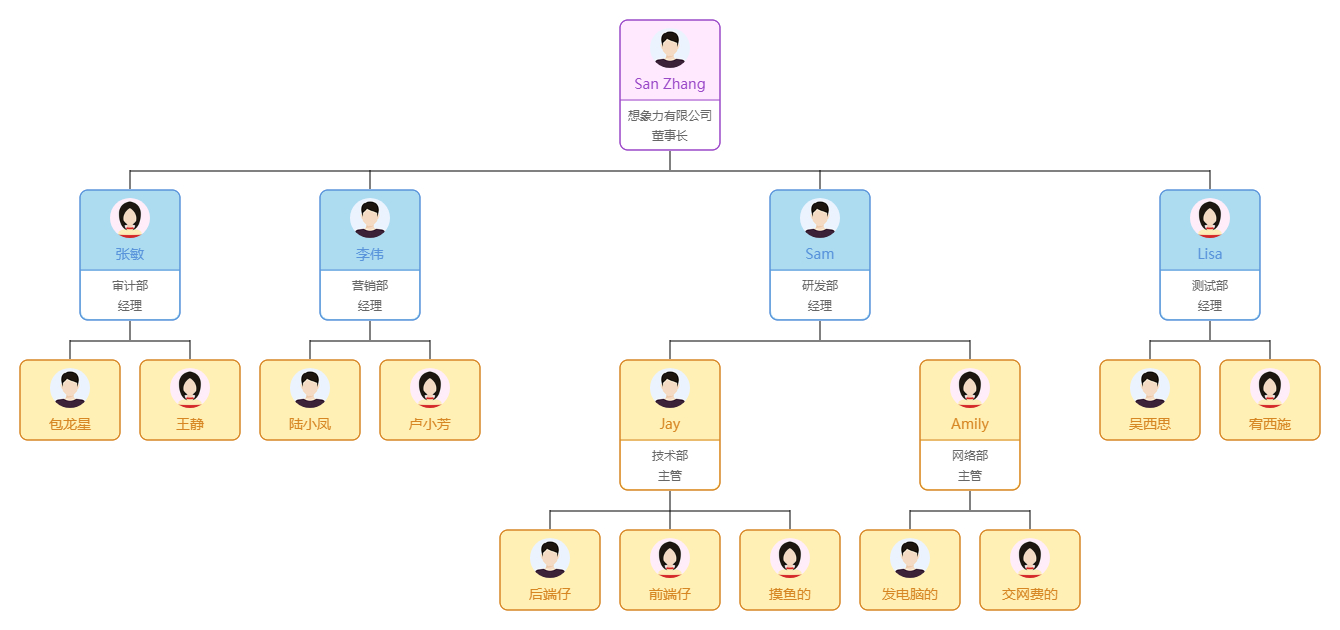
Screenshots