README
d3-soccer
A D3 plugin for visualizing event stream soccer data.

Installing
If you use NPM, npm install d3-soccer. Otherwise, download the latest release. AMD, CommonJS, and vanilla environments are supported. In vanilla, a d3 global is exported:
<script src="https://d3js.org/d3.v5.min.js"></script>
<script type="text/javascript" src="./dist/d3-soccer.js"></script>
<script type="text/javascript">
var pitch = d3.pitch();
var svg = d3.select("#chart").call(pitch);
</script>
API Reference
# d3.pitch()
Creates a new pitch generator with the default configuration values. The pitch contains two layers (#below and #above) which can be used to plot additional markers respectively below and above the pitch markers. The origin is located in the top-left corner of the pitch and the default dimensions are (105, 68).
# pitch(context)
Render the pitch to the given context, which may be either a selection of containers (either HTML, SVG or G elements) or a corresponding transition.

# pitch.height([height])
If a height is specified, it sets the height of the corresponding SVG element and computes the adequate width. If height is not specified, returns the current height, which defaults to 300 px.
# pitch.width()
Returns the current width of the SVG element.
# pitch.rotate([bool])
If bool is specified and set to true, rotate the plot by 90 degrees. If bool is not specified, returns the current setting, which defaults to false.
# pitch.showDirOfPlay([bool])
If bool is specified and set to true, shows an arrow on the plot from left to right to indicate the direction of play. If bool is not specified, returns the current setting, which defaults to false.
# pitch.shadeMiddleThird([bool])
If bool is specified and set to true, the middle third of the pitch is shaded. If bool is not specified, returns the current setting, which defaults to false.
# pitch.goals([goals])
The standard goal markings can be customized by supplying a function to the goals argument. Additionally, the goals argument supports the strings "line" and "box", which correspond to line-style and box-style goal markings. If goals is not specified, returns the current setting, which defaults to line-style markings.
# pitch.clip([clip])
If clip is specified, sets the clipping rectangle and computes the adequate width. clip is specified as a pair of 2D coordinates [x, y]. If clip is not specified, returns the current clipping rectangle, which defaults to: [[0, 0], [105, 68]]
# pitch.pitchStrokeWidth([width])
If width is specified, it sets the stroke width of the pitch markers. If width is not specified, returns the current stroke width, which defaults to 0.5 px.
# d3.heatmap(pitch)
Creates a new heatmap generator with the default configuration values and the specified pitch configuration.
# heatmap(context)
Render the heatmap to the given context, which may be either a selection of containers (either HTML, SVG or G elements) or a corresponding transition. Reads the data for the heatmap from the datum property on the container. This data should be in the following format:
[
  {
    height: 0.99,  // height of the cell
    width: 0.99,   // width of the cell
    x: 4.95,       // x-index of the cell
    y: 54.20,      // x-index of the cell
    i: 5,          // x-index of the cell
    j: 55,         // y-index of the cell
    value: 0       // value of the cell
  },
  ...
]
D3 soccer provides two layouts to convert data to this format: d3.grid() and d3.rectbin() .

# heatmap.colorScale([scale])
If scale is specified, sets the color scale, which should be an instance of d3-scale. If scale is not specified, returns the current color scale, which defaults to d3.scaleSequential(d3.interpolateGreens).
# heatmap.enableInteraction([enable])
If enable is set to true, a border will be drawn around a cell of the heatmap when hovered. Additional actions can be assigned trough onSelect and onDeselect. If not set, returns the current configuration. Interaction is disabled by default.
# heatmap.interpolate([interpolate])
If interpolate is set to true, the heatmap will be interpolated using bicubic interpolation. If not set, returns the current configuration, which defaults to false.
# heatmap.selected([cell])
If cell is specified, sets the selected cell. cell should be specified as 2D coordinates [x, y], where (0,0) corresponds to the top left corner cell. If cell is not specified, returns the current selection. Returns [undefined, undefined] if no cell is selected, which is the default.
# heatmap.onSelect([f])
If f is specified, hovering over a cell will trigger execution of f(x, y, v), where x and y are the coordinates of the selected cell and v the cell value.
# heatmap.onDeselect([f])
If f is specified, stopping hovering over a cell will trigger execution of f().
# d3.actions(pitch)
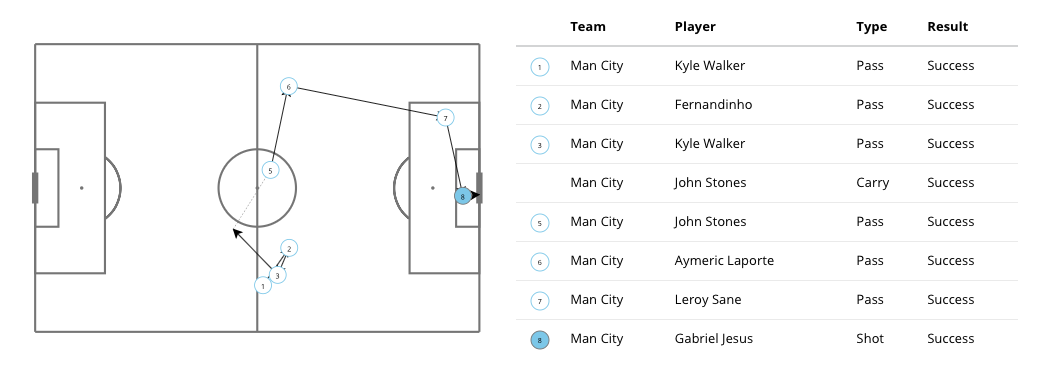
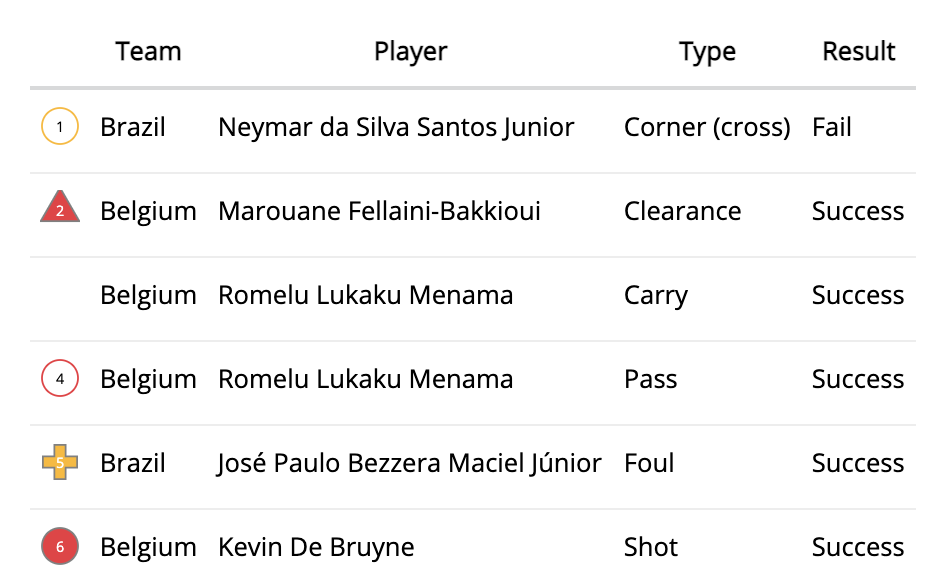
Creates a new generator for plotting soccer actions in the SPADL format with the default configuration values and the specified pitch configuration.
# actions(context)
Render the actions to the given context, which may be either a selection of containers (either HTML, SVG or G elements) or a corresponding transition. Reads the data for the actions from the datum property on the container.

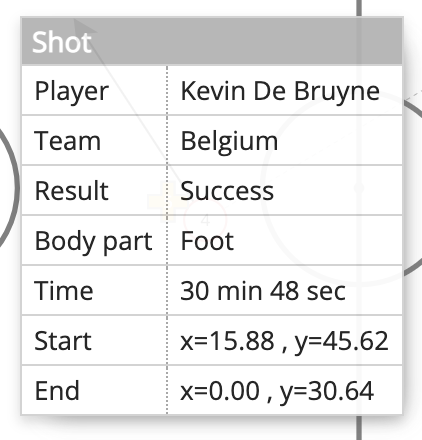
# actions.showTooltip([show])
If show is set to an instance of actionTooltip, will show a tooltip upon hovering an action. If not specified, will return a reference to the current tooltip or false if no tooltip is attached. Defaults to false.
# actions.scale([scale])
If scale is specified, will set the scale of the action markers. If not specified, will return the current scale, which defaults to 4.
# actions.teamColors([colors])
If colors is specified, will set the colors used for the markers of both teams. Excepts a mapping between team ID and a color hex code, for example {782:"#EF3340", 781:"#FDB913"}. If colors is not specified, returns the current mapping between teams and colors, which defaults to {0: "#FDB913", 1: "#87CEEB"}.
# actions.draggable([draggable])
If draggable is set to true, will enable dragging the action markers around and trigger onUpdate. If not specified, returns the current setting which defaults to false.
# actions.onUpdate([f])
If f is specified, dragging an action's marker will trigger execution of f(data), where data are the updated actions.
# d3.actionsTable()
# actionsTable(context)

# actionsTable.tableColumns([columns])
# actionsTable.scale([scale])
# actionsTable.teamColors([colors])
# d3.actionTooltip()
# actionTooltip(context)

# actionTooltip.show([data])
# actionTooltip.hide()
# d3.scoreline()
# scoreline(context)

# scoreline.height([height])
# scoreline.teams([teams])
# scoreline.score([score])
# scoreline.clock([clock])
# d3.grid()
Constructs a new default grid layout, which can be used to generate data for the heatmap.
# grid(values)
Evaluates the grid layout on the specified 2d array of values, returning a 1d array corresponding to the data format required by the heatmap.
# d3.rectbin()
Constructs a new default rectbin layout, which can be used to generate data for the heatmap.
# rectbin(points)
Evaluates the rectbin layout on the specified array of points, returning an array of rectangular bins. Each bin is an array containing the bin’s points, as well as some additional properties which are required by the heatmap.
Bins that are empty are not omitted. The origin bin at ⟨0,0⟩ is in the top-left.
# rectbin.x([accessor])
If accessor is specified, sets the x-accessor function and returns the rectbin layout; if accessor is not specified, returns the current x-accessor function, which defaults to function(d) { return d[0]; }.
# rectbin.y([accessor])
If accessor is specified, sets the y-accessor function and returns the rectbin layout; if accessor is not specified, returns the current y-accessor function, which defaults to function(d) { return d[1]; }.
# rectbin.dx([dx])
If dx is specified, sets the horizontal bin size to the specified value. If dx is not specified, returns the current value, which defaults to 0.1.
# rectbin.dy([dy])
If dy is specified, sets the vertical bin size to the specified value. If dy is not specified, returns the current value, which defaults to 0.1.