README
mermaid 


English | 简体中文
:trophy: Mermaid was nominated and won the JS Open Source Awards (2019) in the category "The most exciting use of technology"!!!
Thanks to all involved, people committing pull requests, people answering questions! 🙏

About
Mermaid is a Javascript based diagramming and charting tool that uses Markdown-inspired text definitions and a renderer to create and modify complex diagrams. The main purpose of Mermaid is to help documentation catch up with development.
Doc-Rot is a Catch-22 that Mermaid helps to solve.
Diagramming and documentation costs precious developer time and gets outdated quickly.
But not having diagrams or docs ruins productivity and hurts organizational learning.
Mermaid addresses this problem by cutting the time, effort and tooling that is required to create modifiable diagrams and charts, for smarter and more reusable content.
The text definitions for Mermaid diagrams allows for it to be updated easily, it can also be made part of production scripts (and other pieces of code).
So less time needs to be spent on documenting, as a separate and laborious task.
Even non-programmers can create diagrams through the Mermaid Live Editor.
Tutorials has video tutorials.
Use Mermaid with your favorite applications, check out the list of Integrations and Usages of Mermaid.
For a more detailed introduction to Mermaid and some of its more basic uses, look to the Beginner's Guide and Usage.
🌐 CDN | 📖 Documentation | 🙌 Contribution | 📜 Changelog
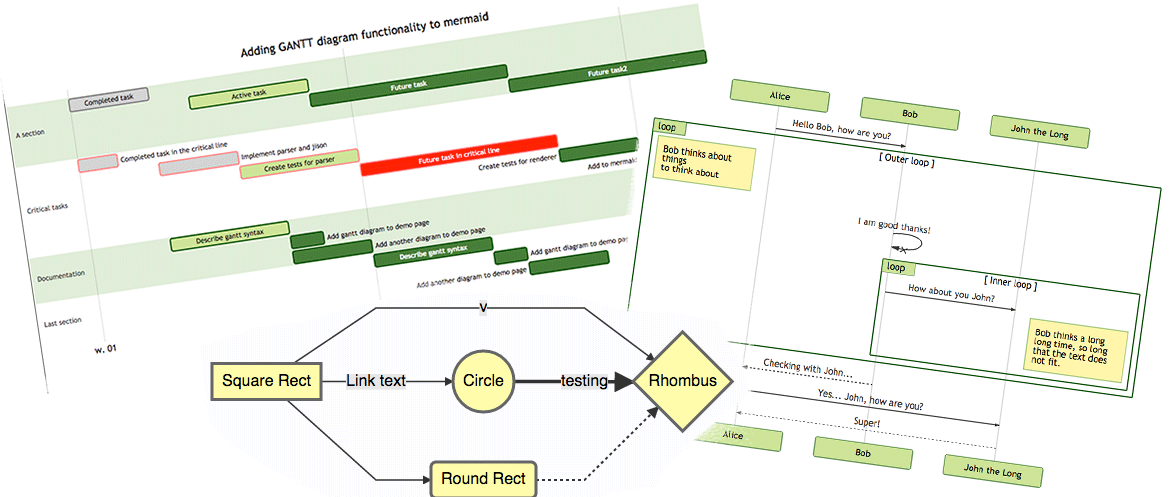
Examples
The following are some examples of the diagrams, charts and graphs that can be made using Mermaid and the Markdown-inspired text specific to it. Click here jump into the text syntax.
Flowchart [docs - live editor]
flowchart LR
A[Hard] -->|Text| B(Round)
B --> C{Decision}
C -->|One| D[Result 1]
C -->|Two| E[Result 2]
flowchart LR
A[Hard] -->|Text| B(Round)
B --> C{Decision}
C -->|One| D[Result 1]
C -->|Two| E[Result 2]
Sequence diagram [docs - live editor]
sequenceDiagram
Alice->>John: Hello John, how are you?
loop Healthcheck
    John->>John: Fight against hypochondria
end
Note right of John: Rational thoughts!
John-->>Alice: Great!
John->>Bob: How about you?
Bob-->>John: Jolly good!
sequenceDiagram
Alice->>John: Hello John, how are you?
loop Healthcheck
    John->>John: Fight against hypochondria
end
Note right of John: Rational thoughts!
John-->>Alice: Great!
John->>Bob: How about you?
Bob-->>John: Jolly good!
Gantt chart [docs - live editor]
gantt
    section Section
    Completed :done,    des1, 2014-01-06,2014-01-08
    Active        :active,  des2, 2014-01-07, 3d
    Parallel 1   :         des3, after des1, 1d
    Parallel 2   :         des4, after des1, 1d
    Parallel 3   :         des5, after des3, 1d
    Parallel 4   :         des6, after des4, 1d
Class diagram [docs - live editor]
classDiagram
Class01 <|-- AveryLongClass : Cool
<<Interface>> Class01
Class09 --> C2 : Where am i?
Class09 --* C3
Class09 --|> Class07
Class07 : equals()
Class07 : Object[] elementData
Class01 : size()
Class01 : int chimp
Class01 : int gorilla
class Class10 {
  <<service>>
  int id
  size()
}
classDiagram
Class01 <|-- AveryLongClass : Cool
<<Interface>> Class01
Class09 --> C2 : Where am i?
Class09 --* C3
Class09 --|> Class07
Class07 : equals()
Class07 : Object[] elementData
Class01 : size()
Class01 : int chimp
Class01 : int gorilla
class Class10 {
  <<service>>
  int id
  size()
}
State diagram [docs - live editor]
stateDiagram-v2
[*] --> Still
Still --> [*]
Still --> Moving
Moving --> Still
Moving --> Crash
Crash --> [*]
stateDiagram-v2
[*] --> Still
Still --> [*]
Still --> Moving
Moving --> Still
Moving --> Crash
Crash --> [*]
Pie chart [docs - live editor]
pie
"Dogs" : 386
"Cats" : 85
"Rats" : 15
pie
"Dogs" : 386
"Cats" : 85
"Rats" : 15
Git graph [experimental - live editor]
User Journey diagram [docs - live editor]
  journey
    title My working day
    section Go to work
      Make tea: 5: Me
      Go upstairs: 3: Me
      Do work: 1: Me, Cat
    section Go home
      Go downstairs: 5: Me
      Sit down: 3: Me
  journey
    title My working day
    section Go to work
      Make tea: 5: Me
      Go upstairs: 3: Me
      Do work: 1: Me, Cat
    section Go home
      Go downstairs: 5: Me
      Sit down: 3: Me
Related projects
Contributors 


Mermaid is a growing community and is always accepting new contributors. There's a lot of different ways to help out and we're always looking for extra hands! Look at this issue if you want to know where to start helping out.
Detailed information about how to contribute can be found in the contribution guide
Reporting vulnerabilities
To report a vulnerability, please e-mail security@mermaid.live with a description of the issue, the steps you took to create the issue, affected versions, and if known, mitigations for the issue.
Appreciation
A quick note from Knut Sveidqvist:
Many thanks to the d3 and dagre-d3 projects for providing the graphical layout and drawing libraries! Thanks also to the js-sequence-diagram project for usage of the grammar for the sequence diagrams. Thanks to Jessica Peter for inspiration and starting point for gantt rendering. Thank you to Tyler Long who has been a collaborator since April 2017.
Thank you to the ever-growing list of contributors that brought the project this far!
Mermaid was created by Knut Sveidqvist for easier documentation.