README
Plot Pack
Javascript data visualization package.
This is currently an early work-in-progress project. Current drives:
- More documentation of usage
- More components
- Release builds
- More functionality and customizability
Chart
Introduction
A chart component that is capable of rendering charts in a flexible and configurable way.
Dependencies and Notable Technologies
- Canvas - For rendering the components.
- kd-tree-javascript - Efficient O(nlog(n)) nearest-neighbor searching
- core-js & @babel/polyfill - For polyfilling
- Typescript - The package is exclusively written in Typescript
Usage
import React from 'react';
import { Chart } from 'plot-pack'
import { Axis2D } from 'plot-pack/lib/common/types/geometry';
import { NumberFormatNotation } from 'plot-pack/lib/common/types/math';
import MarkerType from 'plot-pack/lib/components/chart/types/MarkerType';

const datums = []
const fn = x => Math.sqrt(1000 - x**2) + 0.5
for (let i = -10; i < 10; i++)
  datums.push({ x: i, y: fn(i) })

function App() {
  return (
    <div className="App">
      <div style={{ width: '500px', height: '500px' }}>
        <h1>Chart:</h1>
        <Chart
          title="Math.sqrt(1000 - x**2) + 0.5"
          series={{ 1: datums }}
          axesOptions={{
            [Axis2D.X]: { notation: NumberFormatNotation.DECIMAL, numFigures: 0 },
            [Axis2D.Y]: { notation: NumberFormatNotation.DECIMAL, numFigures: 1 }
          }}
          markerOptions={{ size: 4, type: MarkerType.UPSIDE_DOWN_TRIANGLE, lineWidth: 1 }}
        />
      </div>
    </div>
  );
}

export default App;
Examples
Appearance with default options
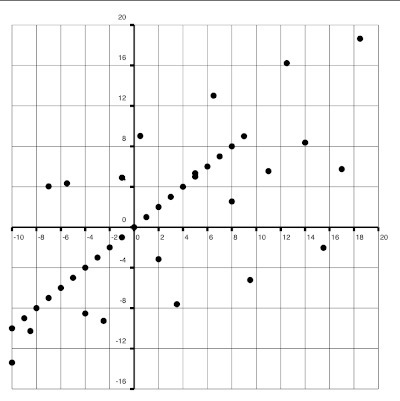
Efficiently displays many points
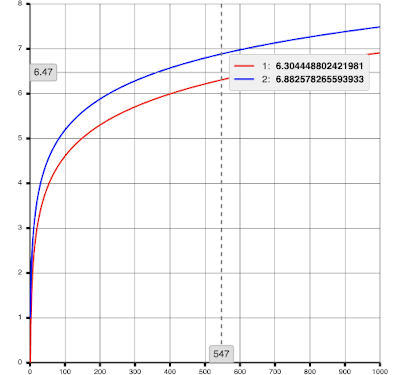
Supports a high degree of customizability
...from the color and layout of the connecting line, markers, and tooltip:
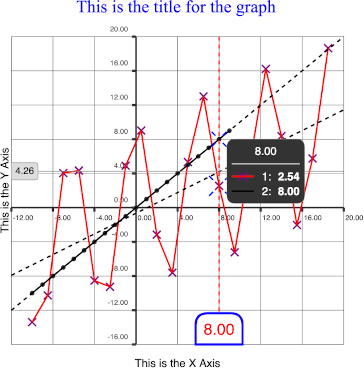
...to being able to replace the marker rendering entirely:
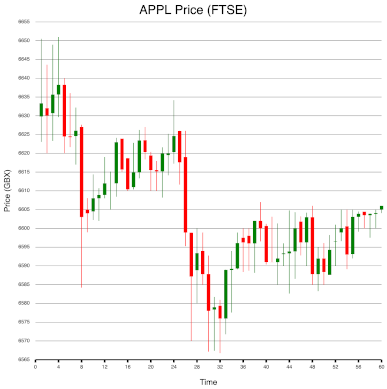
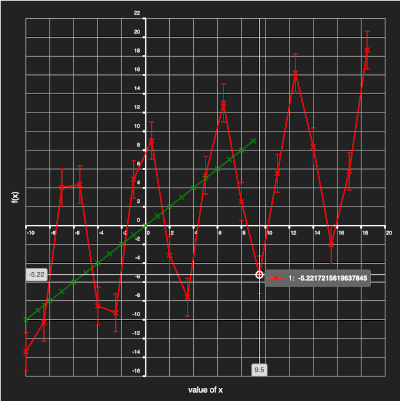
...to dark mode and error bars:
Contributing
Introduction
plot-pack is not currently accepting contribution to the main line at the current time due to the early stage of the package. This will be reconsidered when the package has reached an appropriate level of maturity.
Publishing
npm run build-tsc && npm version patch && npm publish
Advised IDE Extensions
ESLint