README
React Line Graph
A lightweight and simple line graph component.
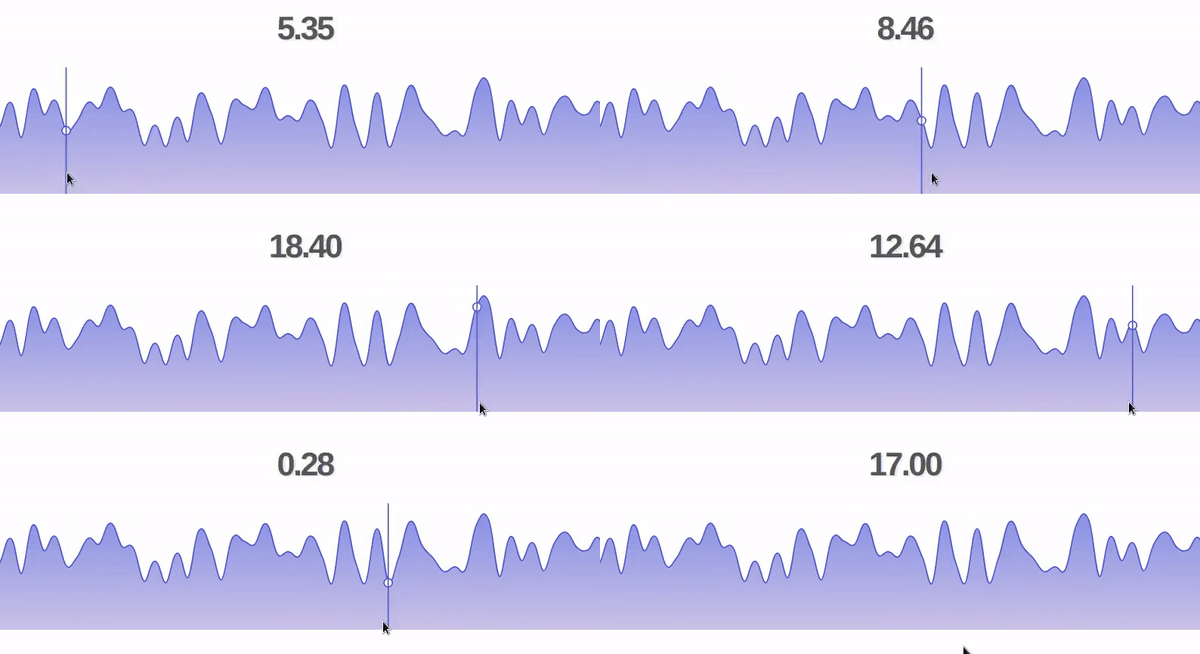
Supports Bezier smoothing, easy customization, and hover interactivity.

Table of Contents
- Requirements
- Installation
- Usage
- Development Setup
- Testing
- Release History
- Meta
- Contributing
- To-do
- Challenges
Requirements
An nvmrc file is included if using nvm.
- Node 8.10.0
Installation
OS X & Linux:
npm install react-line-graph
Usage
Usage is quite simple. First, import the component (React 16.8.0 or higher is required as an installed dependency or CDN):
import LineGraph from 'react-line-graph'
Render the line:
const data = [10,0,-2.5,540]; // LineGraph reads these as y-values, automatically spaces them out evenly
<LineGraph data={data}/>
or
const data = [[0,20], [-30,40], [-88.9, 9]]; // LineGraph reads these as x,y pairs
<LineGraph data={data}/>
or
const data = [ { x: 10, y: 2 }, {...}];
<LineGraph data={data}/>
Customizing your graph is easy:
const data = [10,0,-2.5,540];
const props = {
  data,
  smoothing: 0.3,
  accent: 'palevioletred'
  fillBelow: 'rgba(200,67,23,0.1)',
  hover: true,
};

<LineGraph {...props}/>
This renders a smooth graph with hovering enabled. The y-value is passed down to child components upon hover by default, but this can be changed.
Props
| Key | Type | Default | Description |
|---|---|---|---|
| data | Array (required) | [] | The data points to render. May be of form [a,...,b], [[a,b],...,[c,d]], or [{x: a, y: b},...,{...}] where a,b,c,d are some numbers |
| smooth | Number (0 to 1) | 0 | The Bezier smoothing ratio to apply. |
| accent | String | 'black' | The color of the line accents |
| fillBelow | String | 'none' | The color of the fill below the line. |
| fillAbove | String | 'none' | The color of the fill above the line. |
| hover | Boolean | false | Enables hovering. Hovering will render a line and will pass on the hovered value to children (this component is child-aware). |
| gridX | Boolean | false | Shows the grid-lines along the x-axis (vertical lines). |
| gridY | Boolean | false | Shows the grid-lines along the y-axis (horizontal lines). |
| debug | Boolean | false | Displays debug information on graph, including anchor and control points. |
| width | String | '100%' | The width of the component within a container element. |
| height | String | '100%' | The height of the component within a container element. |
| compression | Number | 0.1 | The compression factor of the data-set from 0 to 1. Compresses data linearly from top and bottom along the Y-axis. |
| onHover | Function | () => {} | The callback function to which an array containing currently hovered point ([x, y]) is passed when the user hovers. Useful for displaying the hovered value in the parent component (the one you write). Only active when 'hover' is set to true. |
For more examples and usage, please refer to the Wiki (under development).
Development setup
For developers (OS X / Linux):
From within the root directory:
npm install
npm start
Testing
From within the root directory:
npm test
Release History
- 1.0.3
- First patched release
- CHANGE: bug-fixes, new features. See release for details.
- 1.0.0
- The first proper release
- CHANGE: Add Bezier smoothing transformation function
- 0.1.0
- Work in progress
Meta
Umair Nadeem – @UmairNadeem – umair@umairnadeem.com
Distributed under the MIT license. See LICENSE for more information.
https://github.com/umairnadeem/react-line-graph
Contributing
- Fork it (https://github.com/umairnadeem/react-line-graph/fork)
- Create your feature branch (
git checkout -b feature/fooBar) - Commit your changes (
git commit -am 'Add some fooBar') - Push to the branch (
git push origin feature/fooBar) - Create a new Pull Request
Feature Requests
- Put all helper methods in a class
- Fix smoothing algorithm to be more precise using cubic Beziers
- Clean up prop passing in InteractionLayer*
- Refactor hover to not use setState (better performance)
- Update compression algorithm to be two-way (compress highs and lows)*
- Allow 3 different data input types (create helper function 'parse')
- Remove unnecessary re-render of graph upon setState in parent component
- Refactor LineGraph's index.jsx with React Hooks*
- Publish on NPM, update README tags*
- Allow multiple transformation functions in drawPath function, using piping
- Prevent re-run of findCtrlPoint function upon hover
- Allow exponential smoothing for large data-sets
Challenges
- Make hovering compatible with responsive height/width: need 3 data points per axis (viewBox dimension, cursor position, current dimension)
- Pass up hovered point information into parent
- Allow parent to setState with point information without triggering unecessary re-render
- Writing a smoothing algorithm using cubic Bezier without artifacts
- Modular transformation callback in drawPath helper


