README
Redux Usage Report
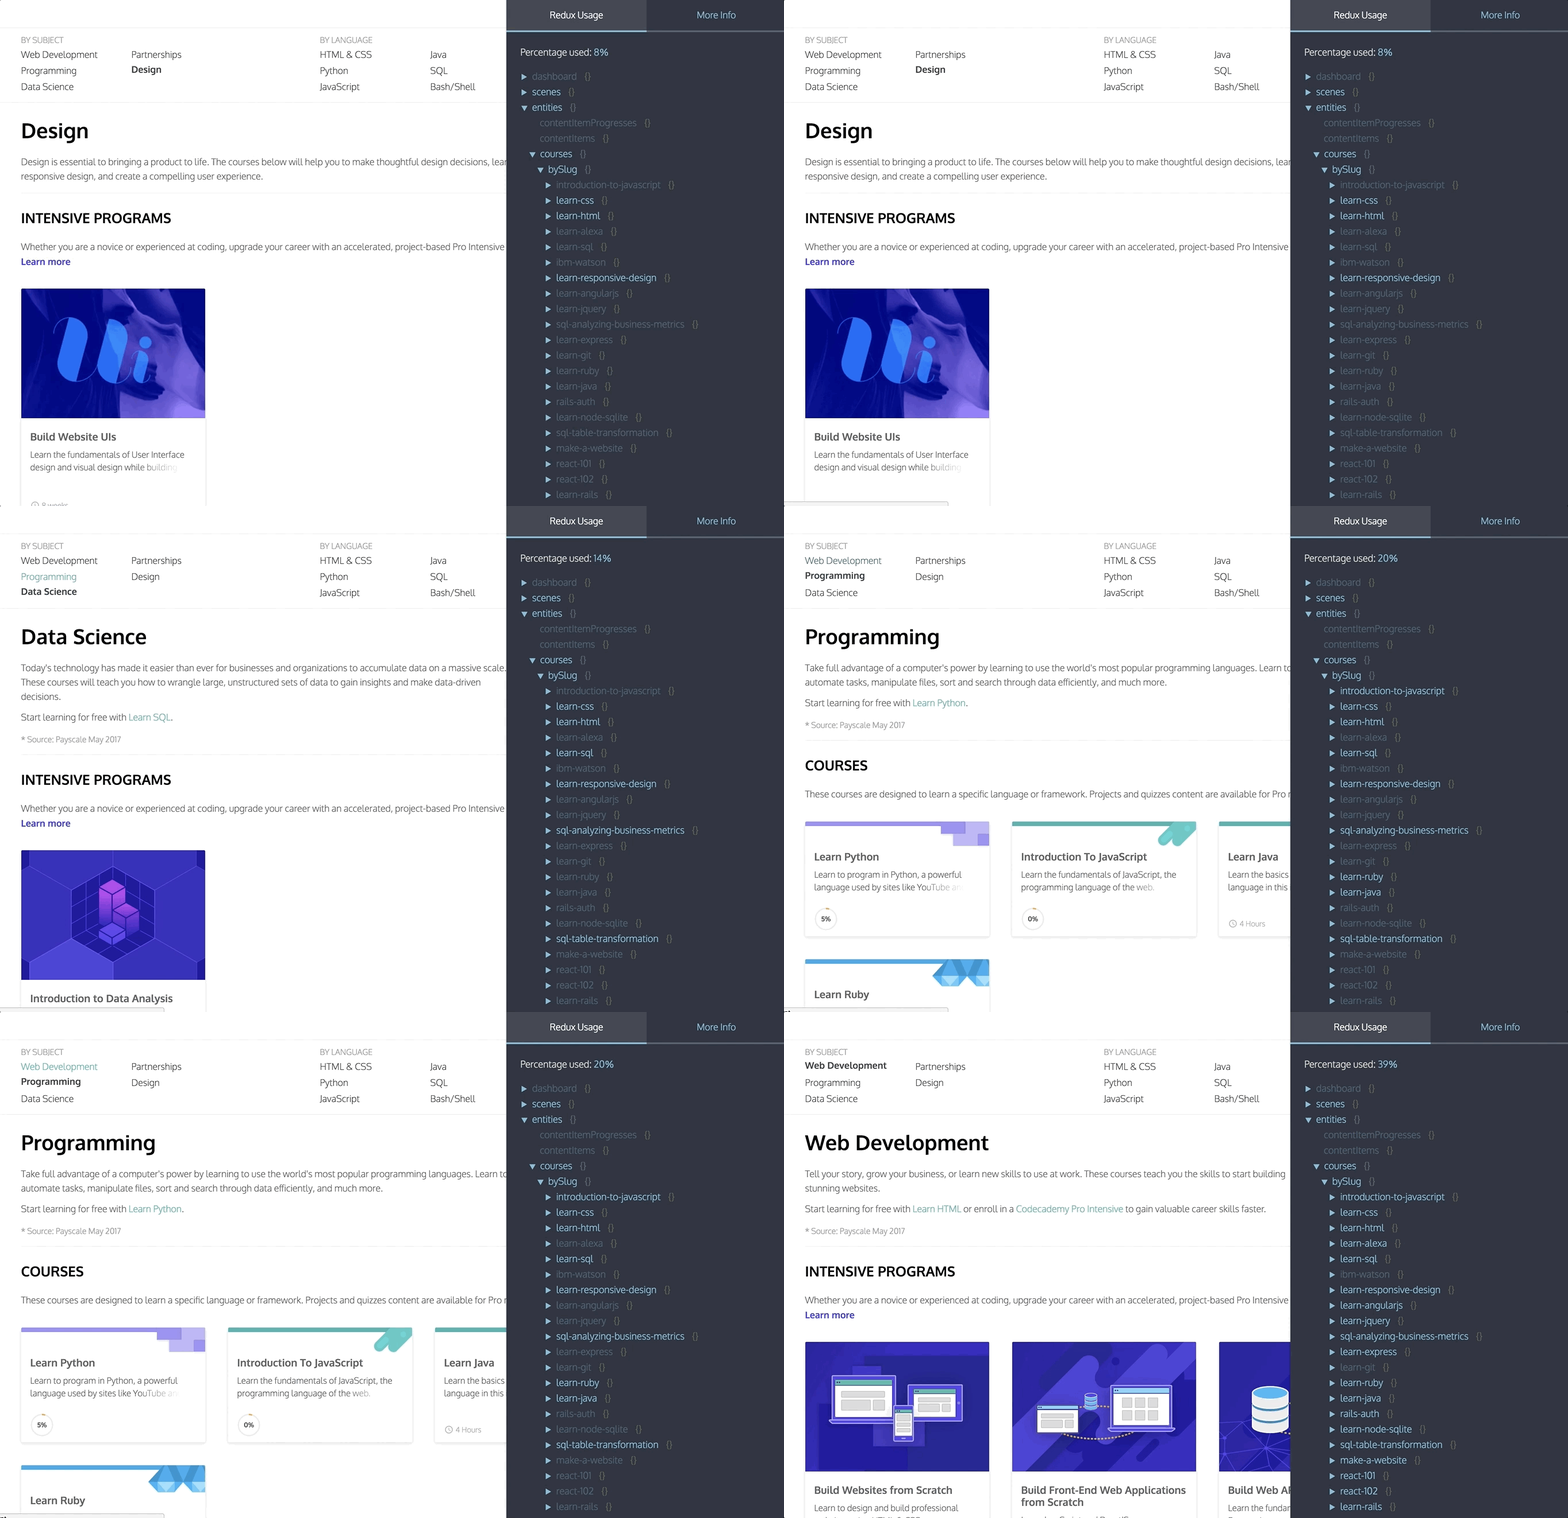
This library tracks the way your app is actually using the data in your Redux store. By setting up the monitor in devtools you can see a live view of when different parts of your store are accessed:

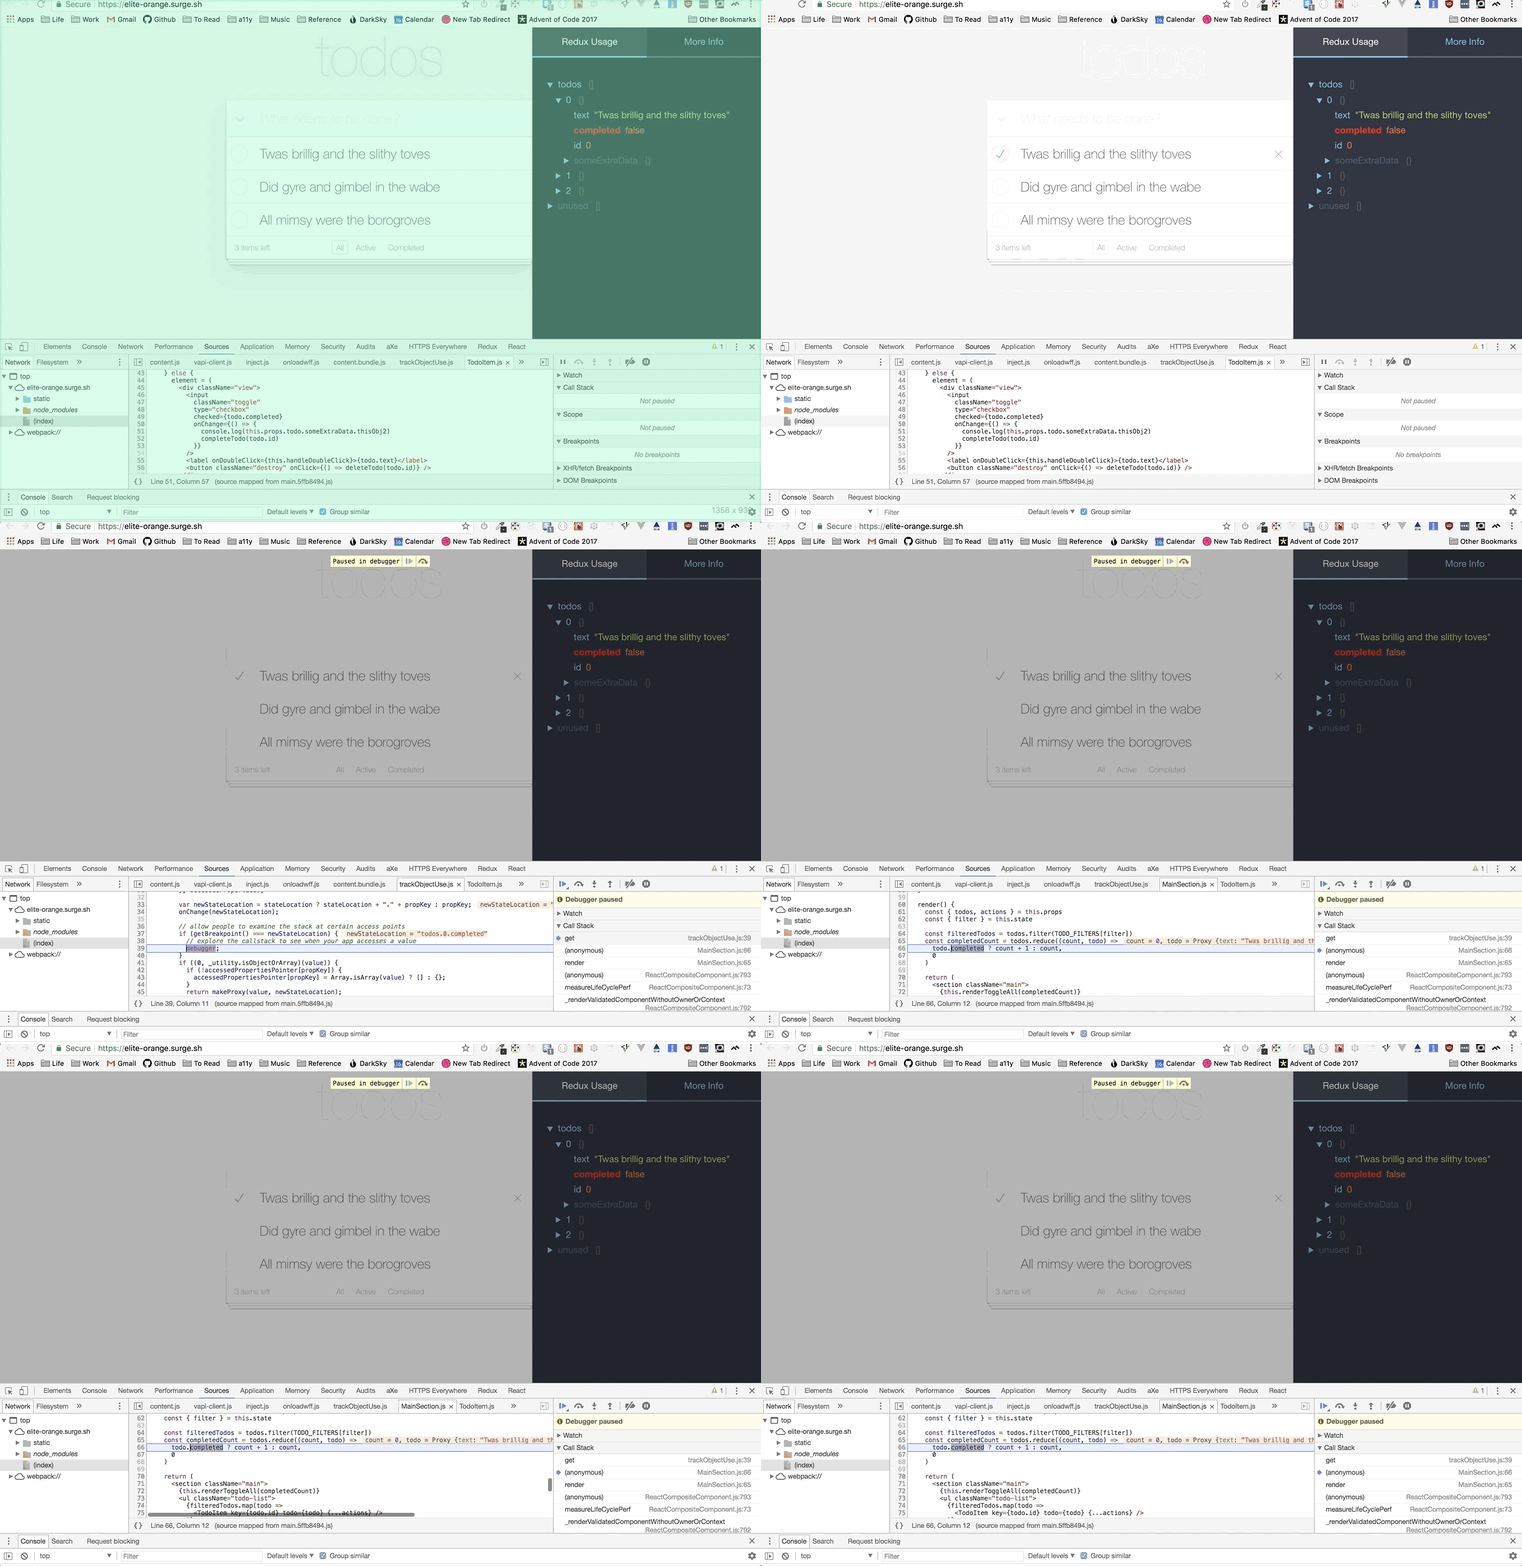
If you want to know exactly when a certain value is being accessed, you can set a breakpoint to explore the call stack when the app touches that particular value.
Demo
Try it out on the TodoMVC app here.
1. Install the required libs
yarn install redux-usage-report redux-devtools redux-devtools-dock-monitor
2. Create the DevTools component
DevTools.js
import React from 'react';
import { createDevTools } from 'redux-devtools';
import DockMonitor from 'redux-devtools-dock-monitor';
import { UsageMonitor } from 'redux-usage-report';

export default createDevTools(
  <DockMonitor toggleVisibilityKey='ctrl-h'
               changePositionKey='ctrl-q'
               changeMonitorKey='ctrl-m'>
    <UsageMonitor />
  </DockMonitor>
);
3. Add the generateReduxReport and the DevTools.instrument store enhancers
Make sure to put the DevTools.instrument() call last in the order of composed functions.
configureStore.js
import { createStore, applyMiddleware, compose } from "redux"
import rootReducer from "platform/state/reducers"

import generateReduxReport from "redux-usage-report"
import DevTools from '../DevTools';

const enhancer = compose(
  generateReduxReport(),
  // DevTools.instrument() should go last
  DevTools.instrument()
  )

const store = createStore(rootReducer, initialState, enhancer)
3. Render <DevTools/> into the app
The easiest way to do this is just render the <DevTools/> component in your App component.
Read more about setting up redux devtools in the official documentation.
Please make sure to only include the devtools for your development build!
How to use it
The json view of your store will show the parts that have been not accessed at reduced opacity, as well as an estimate of the total percentage of your store that has been used so far by your app.
Set a breakpoint
You can set a breakpoint by doing shift + click on any key in the json view. The next time the key is accessed, the debugger will stop execution. Feel free to reload the page, the breakpoint will persist until you remove it by holding shift and clicking it again.

How it works
The generateReduxReport enhancer wraps the store in a proxy, so that each object access can be tracked.
It tries to be smart about ignoring object accesses that come from outside your app's code. For instance, if you're also using the persistStore Devtools plugin, even though that plugin accesses every key in your store, you shouldn't see that reflected in the Usage Report monitor. The monitor attempts to filter out object access that originates in any module located in the node_modules folder or from a browser extension. This filtering logic only works in Chrome, or failing that, if you are using something like the eval option or some other lightweight type of source map that preserves file pathnames in stacktraces.
If you are curious as to why a value is marked "accessed", you can always shift + click the relevant key in the monitor to set a breakpoint.
Performance
If you notice any performance issues, you can speed things up by turning off the most expensive check (whether to ignore object access that originates from node_modules) by typing in the console:
reduxReport.__skipAccessOriginCheck = true