README
SciChart.js: Ultra High Performance Realtime JavaScript Chart Library
SciChart provides a High Performance JavaScript & TypeScript Chart library which uses WebGL and WebAssembly to achieve incredible real-time and big-data performance.
Open the link to find out SciChart.js performance compared to other libraries like Chart.js, Highcharts, etc.
SciChart is the only viable solution for mission-critical data visualization applications, where high quality, fast, and feature-rich charts & graphs are a large part of the application.
Whether you are building Dashboards for business, stock-chart or trading apps, scientific or medical apps, or building a kiosk application on custom hardware with Electron, SciChart's ultra-fast 2D/3D WebGL rendering technology codenamed Visual Xccelerator® will let you build apps, services and dashboards with rich charts & graphs that will delight your users.
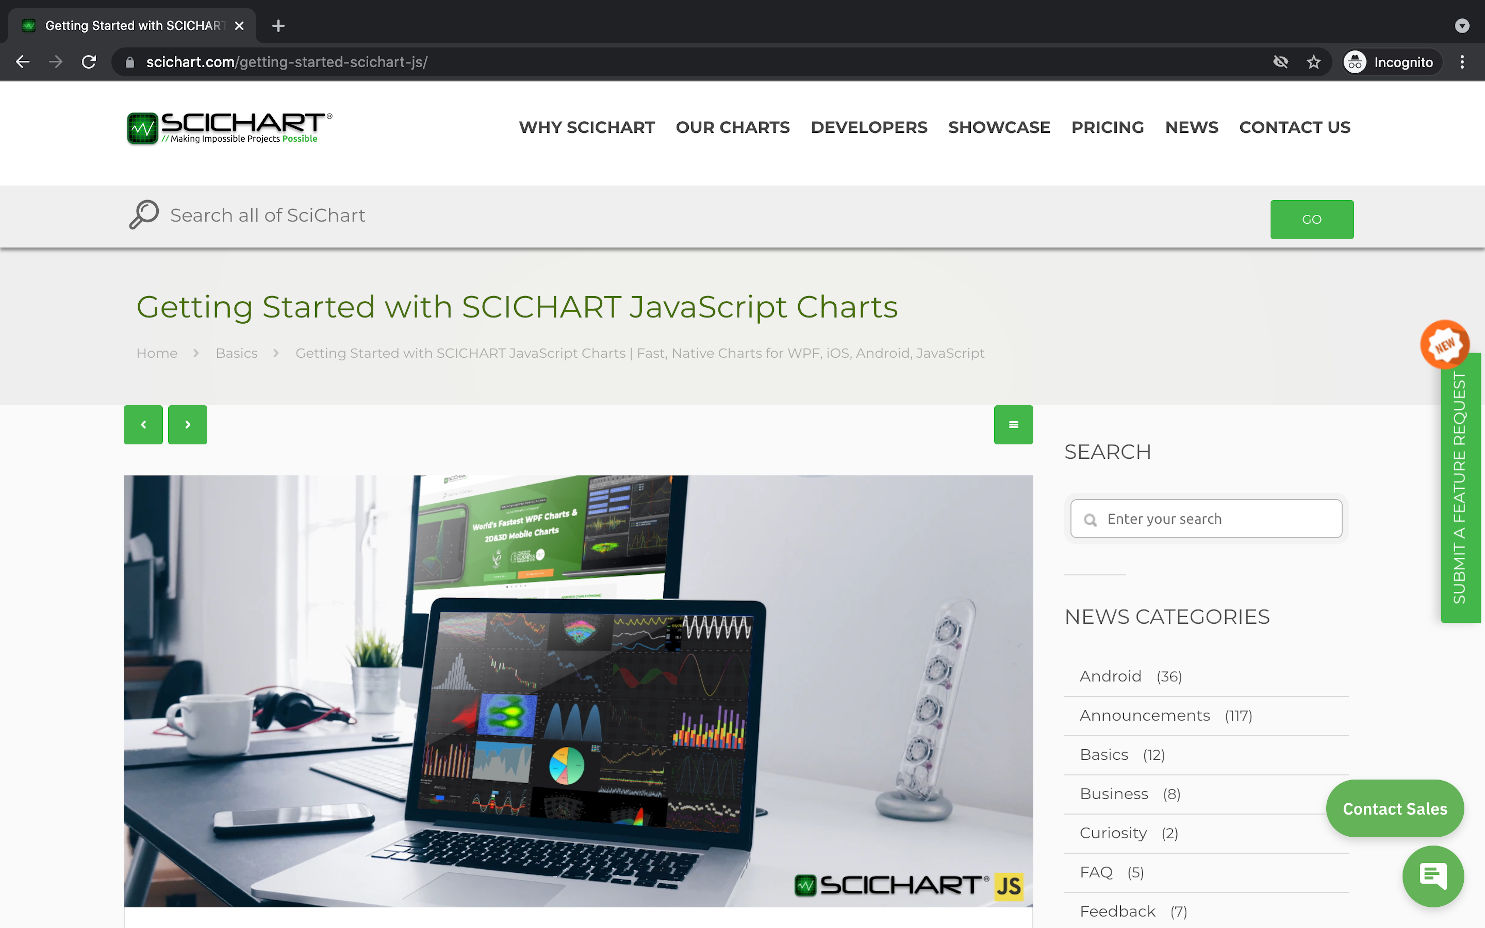
Getting Started
We've prepared a short Getting Started guide here.
Quick Start with Browser Bundle
Make sure you downloaded the Licensing Wizard and started trial
Leave the Licensing Wizard running, it is used to validate licenses.
Create scichart-example.js file with a simple chart
async function initSciChart() {
    // In order to load data file from the CDN we need to set dataUrl
    SciChart.SciChartSurface.configure({
        dataUrl: "https://cdn.jsdelivr.net/npm/scichart@2.1.2261/_wasm/scichart2d.data",
        wasmUrl: "https://cdn.jsdelivr.net/npm/scichart@2.1.2261/_wasm/scichart2d.wasm"
    });
    // Create a chart using the json builder api
    await SciChart.chartBuilder.buildChart("scichart-root", {
        series: {
            type: "LineSeries",
            options: { stroke: "steelblue" },
            xyData: {
                xValues: [1, 2, 5, 8, 10],
                yValues: [3, 1, 7, 5, 8]
            }
        }
    });
}

initSciChart();
See the documentation for IScichart2Ddefinition for all the options available.
Create html file
The file should include scichart.browser.js the same version as in the code snippet above, div element with id "scichart-root" and deferred scichart-example.js script which is executed after the page is loaded.
<!DOCTYPE html>
<html lang="en">
    <head>
        <meta charset="utf-8" />
        <meta name="viewport" content="width=device-width, initial-scale=1" />
        <!-- Include SciChart.js -->
        <script
            src="https://cdn.jsdelivr.net/npm/scichart@2.1.2261/_wasm/scichart.browser.js"
            crossorigin="anonymous"
        ></script>
        <script src="scichart-example.js" defer></script>
        <title>Hello, SciChart.js world!</title>
    </head>
    <body>
        <div id="scichart-root" style="width: 800px; height: 600px;"></div>
    </body>
</html>
Host both files on any web server. As a result you will see a simple line chart. Please note because we are using WebAssembly just opening the HTML file without a server will not work.
Follow the link to find source code for this example.
Quick Start with NPM and Webpack
SciChart.js can be loaded as an ES6 module with Babel or TypeScript transpiler.
Make sure you downloaded the Licensing Wizard and started trial
Leave the Licensing Wizard running, it is used to validate licenses.
Create a new Webpack project or use an existing one.
npm init -y
npm install webpack webpack-cli webpack-dev-server copy-webpack-plugin --save-dev
add start script to package.json
  "scripts": {
    "start": "webpack serve"
  },
Install SciChart.js
npm i scichartAdd webpack.config.js file
Use CopyPlugin to copy wasm and data files and serve them by webpack-dev-server. SciChart.js uses WebAssembly and those files must be loaded.
const path = require('path');
const CopyPlugin = require("copy-webpack-plugin");

module.exports = {
  mode: 'development',
  entry: "./src/index.js",
  performance: {
    hints: false
  },
  output: {
    path: path.resolve(__dirname, 'build'),
    filename: 'bundle.js',
  },
  plugins: [
    new CopyPlugin({
      patterns: [
        { from: "src/index.html", to: "" },
        { from: "node_modules/scichart/_wasm/scichart2d.data", to: "" },
        { from: "node_modules/scichart/_wasm/scichart2d.wasm", to: "" }
      ]
    })
  ]
};
Create a simple chart by putting this into
src/index.jsfileimport { SciChartSurface } from "scichart/Charting/Visuals/SciChartSurface"; import { NumericAxis } from "scichart/Charting/Visuals/Axis/NumericAxis"; import { XyDataSeries } from "scichart/Charting/Model/XyDataSeries"; import { FastLineRenderableSeries } from "scichart/Charting/Visuals/RenderableSeries/FastLineRenderableSeries"; // You may need this to configure from where wasm and data files are served // SciChartSurface.configure({ dataUrl: "/custom/scichart2d.data", wasmUrl: "/other/scichart2d.wasm" }); async function initSciChart() { // Create the SciChartSurface in the div 'scichart-root' // The SciChartSurface, and webassembly context 'wasmContext' are paired. This wasmContext // instance must be passed to other types that exist on the same surface. const { sciChartSurface, wasmContext } = await SciChartSurface.create("scichart-root"); // Create an X,Y Axis and add to the chart const yAxis = new NumericAxis(wasmContext); sciChartSurface.xAxes.add(xAxis); sciChartSurface.yAxes.add(yAxis); const dataSeries = new XyDataSeries(wasmContext, { xValues: [1, 2, 5, 8, 10], yValues: [3, 1, 7, 5, 8] }); const renderableSeries = new FastLineRenderableSeries(wasmContext, { dataSeries, stroke: "steelblue" }); sciChartSurface.renderableSeries.add(renderableSeries); } initSciChart();Create src/index.html file
<html lang="en-us">
    <head>
        <meta charset="utf-8" />
        <meta content="text/html; charset=utf-8" http-equiv="Content-Type" />
        <title>SciChart.js Tutorial 1</title>
        <script async type="text/javascript" src="bundle.js"></script>
    </head>
    <body>
        <!-- the Div where the SciChartSurface will reside -->
        <div id="scichart-root" style="width: 800px; height: 600px;"></div>
    </body>
</html>
Run it
npm start. As a result you will see a simple line chart.
Follow the link to find source code for this example.
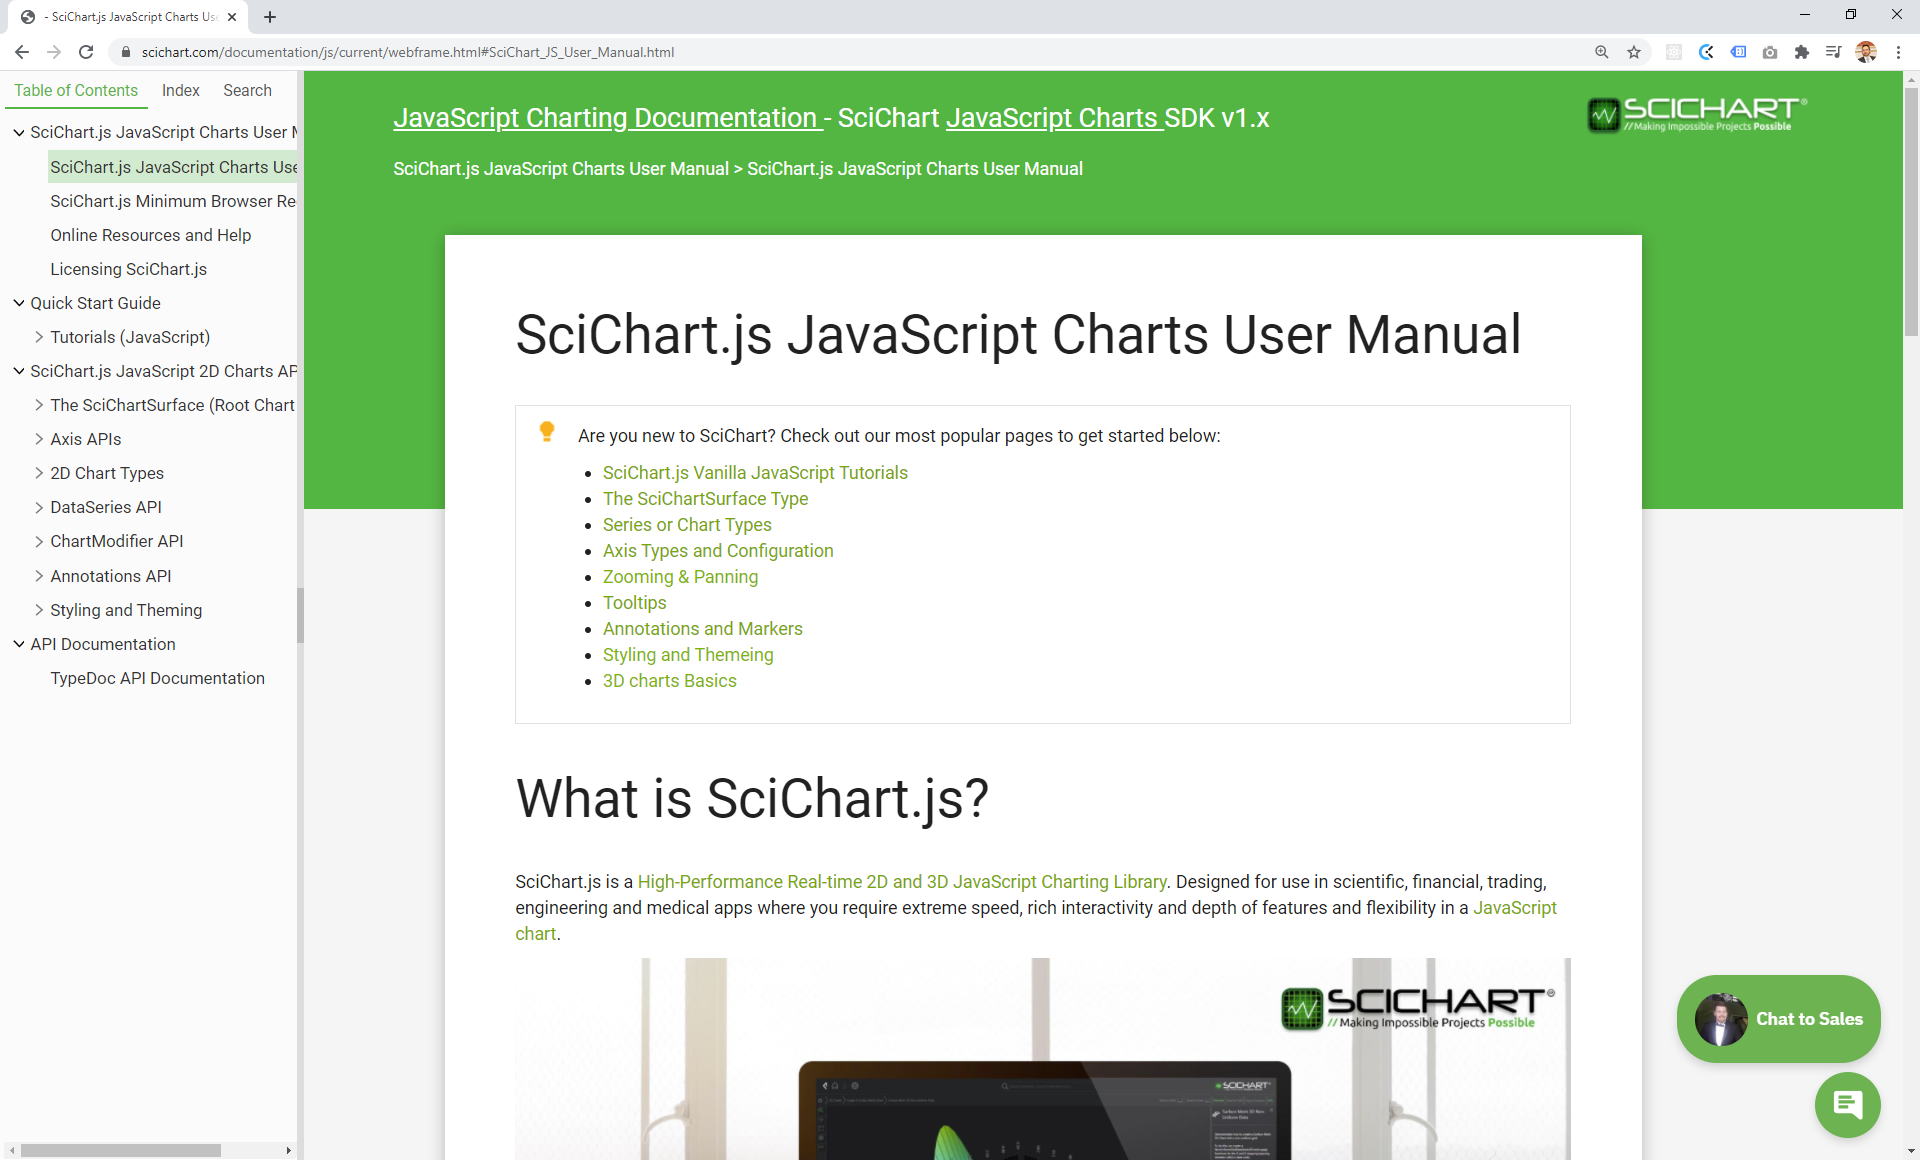
Documentation
We've taken the time to create hundreds of documentation pages for our JavaScript Charts, which you can find over at https://www.scichart.com/javascript-chart-documentation. Take a look here for tutorials, getting-started guides, API Docs (TypeDoc) and more.
Online Demo
An online demo version of scichart.js.examples can be seen at https://demo.scichart.com. Get the source for the demos and examples at https://github.com/abtsoftware/scichart.js.examples
Release Notes
Version 2.1 with Major Performance Improvements
We’ve used our expertise high performance computing in other platforms of SciChart to make massive improvements to chart rendering, updating and startup speed in SciChart.js v2.1.
Performance improvements:
- Smart Data-point Resampling was implemented. Datapoint resampling ensures the minimum viable data-set is displayed on the screen. Resampling is intended to be visually lossless, and automatic.
- Improved raw drawing speed of our underlying graphics engine by over 100%
- Added Async Label Creation option with global application or per-chart caching
- Optimised data transfers from JavaScript to WebAssembly
- Improved chart performance when using RolloverModifier and CursorModifier
- Implementation of Auto-detecting data distribution flags in DataSeries (flags dataSeries.isSorted, dataSeries.containsNaN). Specifying these flags gives better performance in big-data scenarios.
- Optimizations for Annotation notifyPropertyChange method not to be called if the property has not changed
- Display performance warnings in dev environment
- Optimisation getXRange() algorithm for unsorted data
Documentation:
- Added Documentation of how to use SciChart.js in vannilla HTML/Js (without npm) using our Browser Bundle served by CDN
- Added Documentation for Performance Tips & Tricks
- Added Documentation for new Data-point Resampling features
- Added Documentation & Examples for new Generic Animations API
Live demo demo.scichart.com:
- Added Generic Animations example to the Demo app
Other improvements:
- Added labels support outside of a Pie Chart
- Better error message if wasm cannot be loaded, or the wrong version loaded
- Add a property to configure stacked axis length
- Allow passing div element reference into SciChartSurface.create to make SciChart.js possible to use in shadow DOM
- Improve guard checks for data series creation
- Snap RolloverModifier vertical line to data points
- Add explanation error message for trial expired on old version
- Add AxisRenderer.axisSize property which allows setting axis label width
- Add includeAxis property to MouseWheelZoomModifier
- Add AxisRenderer.axisThickness
- Prevent CursorModifier axis labels to be cut out of the chart
See all the details at SciChart.js v2.1 release.
Version 2.0
SciChart.js v2 is a huge release with many new features, improvements and fixes including:
- New pure-json builder api
- Data and Style Animations
- Logarithmic Axis, Inner Axis, Stacked Axis
- Datapoint and Series Selection
- Data filters and transformations
- Retina / High DPI Display / Browser Zoom Support
- Axis label customization, rotated and multiline text and images
- Transparent/image backgrounds
- Loader customization
- And many more!
See all the details at SciChart.js v2 release.
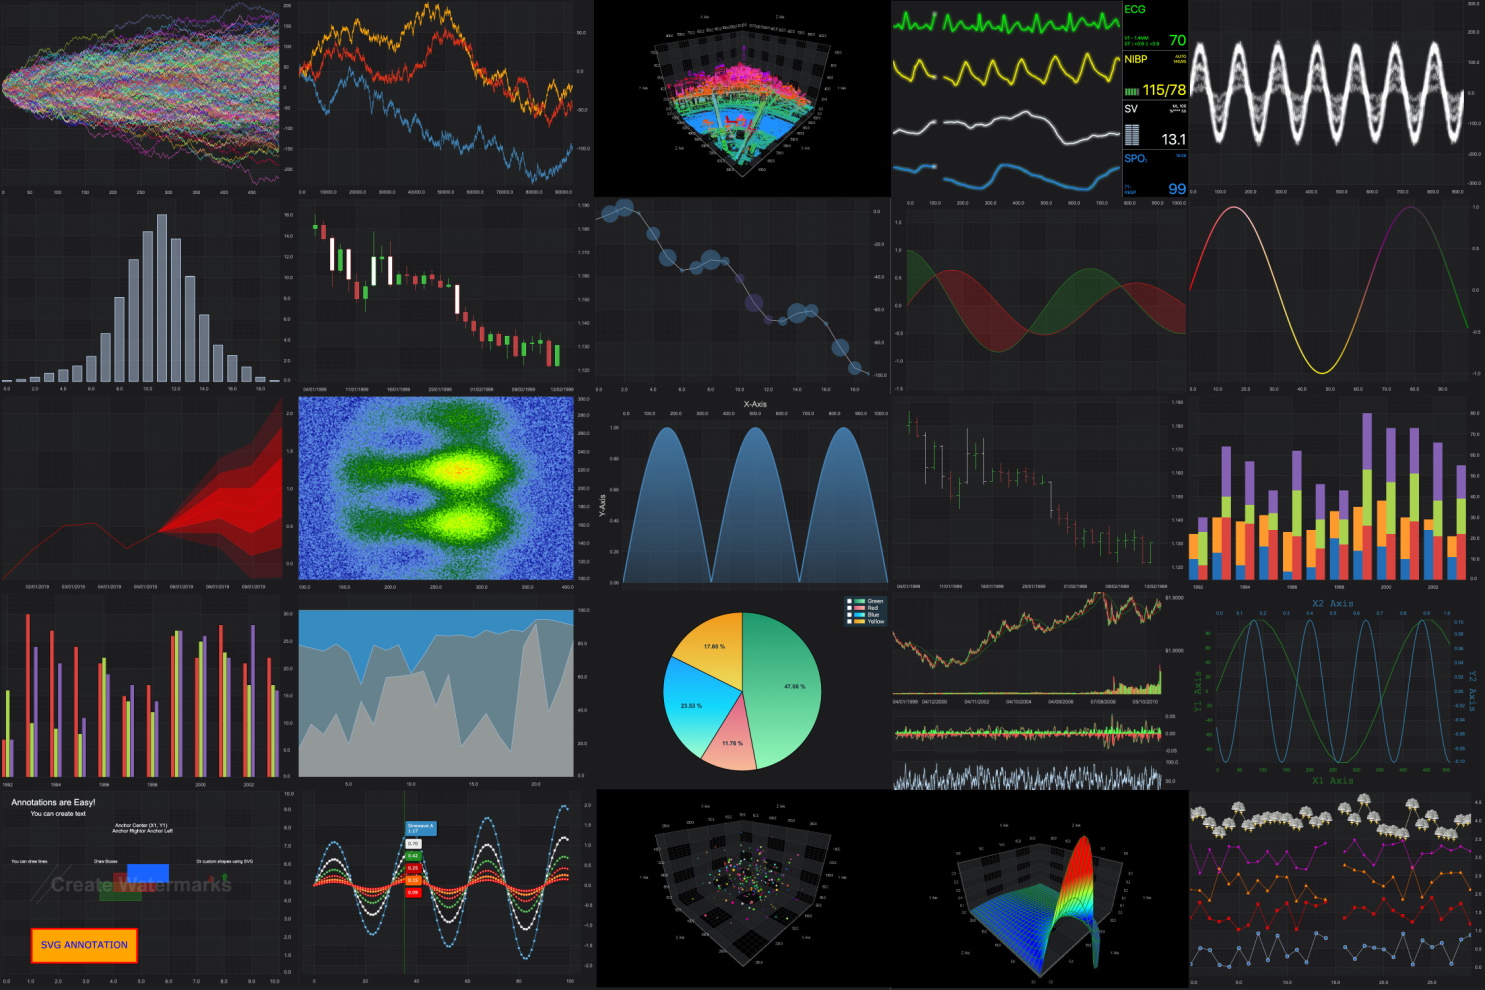
Our Chart Features
An up to date list of features can be found at scichart.com/javascript-chart-features.
JavaScript Chart Types
Supports many 2D & 3D Chart types including:
- Line Chart
- Digital (Step) Line Chart
- Area / Mountain Chart
- Digital (Step) Area / Mountain Chart
- Column Chart
- Stacked Column Chart
- 100% Stacked Column Chart
- Scatter Chart
- Bubble Chart
- Pie Chart
- Donut Chart
- Candlestick Chart
- Ohlc Chart
- Band (High low Fill) Chart
- Digital (Step) Band Chart
- Heatmap or Spectrogram Chart
- Fan Chart
- Contours Chart
- Stacked Mountain Chart
- 3D Surface Mesh or 3D Area Chart
- 3D Bubble Chart
- 3D Point Cloud Chart
Insane Realtime performance
SciChart's Ultra High performance JavaScript Charts can draw many millions of data-points, allowing you to zoom, pan, or browse big-data sets with ease. SciChart enables next-generation JavaScript & TypeScript chart applications by allowing previously impossible datarates and update-rates. After all, we make 'Impossible projects possible'!

Rich Interactive Charts
Drag to zoom, pan, mousewheel zoom, drag axis to zoom, zoom extents or touch behaviour is all supported out of the box.

Chart Animations
SciChart.js supports multiple types of animations to make impressive dashboards and browser applications which will delight your users.
Add series animations which execute when a chart type is shown. Data animations morph or animate from one dataset to another. Style Animations - allow you to animate style (line/fill colour, line thickness) from one set of properties to another.
Cursors & Tooltips
Our JavaScript Chart library features rich cursors & tooltips out of the box, which are built on our powerful ChartModifier API
Choose from built-in Cursors, Crosshairs, Tooltips on mouse/touch or Rollover (showing vertical lines) as well as Legends. Decide what information is presented in a tooltip. Style tooltips to fit your application.

Annotations & Markers
Our JavaScript Chart library features a powerful Annotations API which allows you to overlay Line, Text, Boxes, Shapes or Watermarks over the chart, at specific X/Y data locations. Annotations update position as you zoom or pan the chart.

Styling & Theming
SciChart.js features several themes out of the box, including Light Theme and Dark Theme. SciChart supports building Custom Themes either inheriting our own or completely bespoke.
Our charts support transparent background, image background, blurred or glass effect background. Style SciChart to fit your application and delight your users!

Many Axis Types and Options
SciChart.js features multiple axis types out of the box, including Numeric Axis, Category Axis (Stock Chart axis) and Logarithmic Axis.
Format labels as Dates, numbers, strings (text) or images. Multi-line text labels and rotated axis labels are supported. Full control over axis label format, label style and label / gridline interval is possible with SciChart.js. The flexibility of our JavaScript charts are second to none.
Unlike other JavaScript Charts that only support a single X and Y axis, SciChart.js supports unlimited, multiple X & Y Axis.
You can scale series independently, have left, right, top or bottom axis. You can scale axis independently.

Vertical Charts
SciChart.js supports vertical or rotated charts. Set a YAxis alignment to the left, and XAxis alignment to the top, and this will rotate a chart 90 degrees.

Chart Series Selection
SciChart.js features serles selection and hover events on click. We've also packaged a Chart Modifier which will apply selected or hovered series styling to the chart.
Get notified when a user clicks on a chart series. Use this to perform visual-feedback of selection or chart drill-down, making for compelling interactive browser apps.

Chart Data point selection
SciChart.js also supports data-point selection by clicking or dragging a rectangle on the chart.
Get notified when a user clicks a data-point by events and callbacks. Use this to update the selection visual and create an extra layer of interaction to data-driven apps.

Per-Point Colouring
With SciChart.js you can colour data-points based on a rule e.g. would you like all data-points with value > 10 to be coloured red? With our PaletteProvider API you can do this.
Colour volume bars in a stock chart red or green based on up or down, dynamically style data-points or sections of the chart based on thresholds, custom objects and more.

Financial Stock Charts
SciChart.js supports dynamic, real-time Candlestick and Ohlc charts. Connect our charts to real-time exchange data and they can tick & update in real-time. Our performance is second-to-none making SciChart.js perfect for financial stock chart apps.

Scrolling Overview
Another stock-chart related feature, we've added a Scrolling Overview control to the SciChart.js library. This allows you to see a history of the entire chart data and scroll back & forth instantly. Perfect for financial & stock chart apps!

Link Multiple Charts
With SciChart.js you can link multiple charts. Synchronize Zooming and Panning across charts. Have a single tooltip shared across chart surfaces. Create multi-pane stock charts with technical indicators.
Plus, with support for hundreds of WebGL powered charts on a single webpage, you won't get caught short running out of WebGL contexts or experience slow performance with SciChart.

Filters and Data Transforms
SciChart.js features a filters and data-transforms API. Add moving averages, linear trendlines to a chart. Scale and Offset a series. Calculate the ratio between two series.
All SciChart's filters update dynamically as the underlying data updates. What's more, you can create custom filters to transform your data dynamically and on the fly.

Builder API & JSON Serialization
The Builder API - allows you to create chart definitions with JSON or JavaScript objects. It's never before been easier to create JavaScript charts with SciChart.js. Define your charts on the server, or in a re-usable React component and share them throughout your app.
With SciChart.js every type is JSON Serializable, so you can now create entire chart definitions server-side out of JSON objects and rehydrate them on the client. Save/load chart settings to JSON, allowing rich, dynamic apps with our powerful JavaScript Chart library.

Accessibility
We've build Accessibility hooks into SciChart.js making it suitable for enterprise-grade applications.
Accessibility features include Voiceover (text to speech for chart parts), Theming, Scaling of fonts with Browser zoom / DPI. color and contrast, and keyboard interaction on the chart.
Plot 3D Scientific Charts
With SciChart.js you can plot 3D Scientific Charts such as this 3D Surface Mesh (3D Mountain or Area chart), 3D Bubble, Scatter or point-cloud.
With the help of our cross-platform Visual Xccelerator 3D engine you can plot scientific surface mesh charts in real-time with tens of thousands of cells JavaScript and TypeScript applications.

Plot 3D Point Clouds
Our 3D Scatter / Bubble and Point-cloud chart types allow you to plot 3-dimensional data with XYZ points.
For the first time you can use our powerful JavaScript 3D Chart library to visualise point-cloud outputs from LIDAR, UAV, self-driving car sensors, or plot the relationship between values in scientific, machine learning or statistical data with 3 or 4 (XYZ, Color) or 5 (XYZ, Color, Size) dimensions.

Heatmaps and Spectrograms
SciChart.js features multiple axis types out of the box, including Numeric Axis, Category Axis (Stock Chart axis) and Logarithmic Axis.
Format labels as Dates, numbers, strings (text) or images. Multi-line text labels and rotated axis labels are supported. Full control over axis label format, label style and label / gridline interval is possible with SciChart.js. The flexibility of our JavaScript charts are second to none.

Enterprise Grade Support
With Open Source JavaScript Charts you may find yourself stuck without technical support if something goes wrong. SciChart provides enterprise grade technical support which has been 5-Star Rated for many years.
Many competitors have a limit of support, but we provide 1-year unlimited technical support and latest-version updates (subject to fair use policy) to all our customers. Our customers find our tech-support to be a huge time & money saver. If you want to build excellent quality projects, build them quickly and solve problems when they occur, choose SciChart.js